Executive Summary
validateDrp.py Cfht/output
[...]
PA1(RMS) = 17.61+-0.00 mmag
PA1(IQR) = 18.72+-0.54 mmag
--
minimum: PF1=20% of diffs more than PA2 = 22.36 mmag (target is < 15 mmag)
design : PF1=10% of diffs more than PA2 = 28.40 mmag (target is < 15 mmag)
stretch: PF1= 5% of diffs more than PA2 = 34.99 mmag (target is < 10 mmag)
--
minimum: PF1=18% of diffs more than PA2 = 15.00 mmag (target is < 20 %)
design : PF1=18% of diffs more than PA2 = 15.00 mmag (target is < 10 %)
stretch: PF1=26% of diffs more than PA2 = 10.00 mmag (target is <  5 %)
--
Median RMS of distances between pairs of stars.
  DESIGN goals
  For stars from 17.00 < mag < 21.50 and D = [4.00, 6.00] arcmin
AM1=8.02 mas (target is < 10 mas).
  6.44% of sample deviates by >30 mas (target is < 10%)
--
Median RMS of distances between pairs of stars.
  DESIGN goals
  For stars from 17.00 < mag < 21.50 and D = [19.00, 21.00] arcmin
AM2=7.41 mas (target is < 10 mas).
  4.17% of sample deviates by >30 mas (target is < 10%)
Calculates, prints, plots, and saves validation metrics for the calibrated data in that repository.
Tested and works on CFHT (validation_data_cfht), DECam (validation_data_decam), and HSC (validation_data_hsc).
For more details on the package itself and installation, see https://github.com/lsst/validate_drp
Sample Data
While validate_drp will run on any data set, three sets of data from instruments similar to LSST (CFHT, DECam, and HSC) were created to provide end-to-end examples of producing an output data repository and analyzing it with validate_drp. These have also proven to be useful for debugging and checking the results of algorithmic and configuration changes in the pipeline code.
validation_data_cfhtcontains test CFHT data and selected SDSS reference catalogs in astrometry.net format.validation_data_decamcontains test DECam data and selected SDSS reference catalogs in astrometry.net format.validation_data_hscprovides a full set of data and analyses to test the process of HSC data byobs_subaru.
Despite not having been developed on HSC data, validate_drp runs on the generated repository with no additional configuration needed.
Examples
Run on sample CFHT data
setup obs_cfht
setup validation_data_cfht
setup validate_drp
validateDrp.py ${VALIDATION_DATA_CFHT_DIR}/data --configFile ${VALIDATION_DATA_CFHT_DIR}/examples/CfhtParameters.yaml
analyzes the existing output repository in validation_data_cfht
There is a configuration file examples/CfhtParameters.yaml that specifies selection of stars (for now) to analyze and a current set of KPM thresholds to meet.
# Configuration information for validate_drp to
#   1. build the list of data IDs to analyze
#   2. load the default magnitude ranges, expected peformance, and num matches
good_mag_limit: 21.0  # Only consider stars bright than this limit
medianAstromscatterRef: 25  # expected astrometric variability [mas]
medianPhotoscatterRef: 25  # expected photometric variability [mmag]
matchRef: 5000  # Number of stars expected to match.  Update if you change the ccd list below
requirements: {PA1: 25, PF1: 25, PA2: 40, AM1: 12, AF1: 10, AM2: 12, AF2: 10, AM3: null, AF3: null}
requirementsUnits: {PA1: 'mmag', PF1: '%', PA2: 'mmag', AM1: 'mas', AF1: '%', AM2: 'mas', AF2: '%', AM3: 'mas', AF3: '%'}
The output includes some details on the number of sources found in each visit and then some useful and key summary statistics and model fit results:
[...]
Median value of the astrometric scatter - all magnitudes: 59.392 mas
Astrometric scatter (median) - snr > 100.0 : 9.9 mas
Median value of the photometric scatter - all magnitudes: 115.891 mmag
Photometric scatter (median) - SNR > 100.0 : 13.0 mmag
[ 1600.487519       4.72002127]
$C\theta$, $\sigma_{\rm sys}$ =
1600, 4.72 [mas]
[  8.11136881e-08   3.88988265e-02   2.43744787e+01]
$\sigma_{\rm sys} {\rm [mmag]}$, $\gamma$, $m_5 {\rm [mag]}$=
0.0001, 0.0389, 24.374
No stars found that are 199.0--201.0 arcmin apart.
=============================================
Detailed comparison against SRD requirements.
The LSST SRD is at:  http://ls.st/LPM-17
PA1(RMS) = 17.61+-0.00 mmag
PA1(IQR) = 18.72+-0.54 mmag
--
minimum: PF1=20% of diffs more than PA2 = 22.36 mmag (target is < 15 mmag)
design : PF1=10% of diffs more than PA2 = 28.40 mmag (target is < 15 mmag)
stretch: PF1= 5% of diffs more than PA2 = 34.99 mmag (target is < 10 mmag)
--
minimum: PF1=18% of diffs more than PA2 = 15.00 mmag (target is < 20 %)
design : PF1=18% of diffs more than PA2 = 15.00 mmag (target is < 10 %)
stretch: PF1=26% of diffs more than PA2 = 10.00 mmag (target is <  5 %)
--
Median RMS of distances between pairs of stars.
  DESIGN goals
  For stars from 17.00 < mag < 21.50 and D = [4.00, 6.00] arcmin
AM1=8.02 mas (target is < 10 mas).
  6.44% of sample deviates by >30 mas (target is < 10%)
--
Median RMS of distances between pairs of stars.
  DESIGN goals
  For stars from 17.00 < mag < 21.50 and D = [19.00, 21.00] arcmin
AM2=7.41 mas (target is < 10 mas).
  4.17% of sample deviates by >30 mas (target is < 10%)
No results available for AM3
No results available for AF3
=======================================================
Comparison against *LSST SRD* 'design' requirements.
Measured           Required      Passes
PA1 : 18.55 mmag <  5.00 mmag == False
PF1 : 17.14 %    < 10.00 %    == False
PA2 : 28.40 mmag < 15.00 mmag == False
AM1 :  8.02 mas  < 10.00 mas  == True
AF1 :  6.44 %    < 10.00 %    == True
AM2 :  7.41 mas  < 10.00 mas  == True
AF2 :  4.17 %    < 10.00 %    == True
No results available for AM3
No results available for AF3
Failed metric, filter: PA2, r
Failed metric, filter: PA1, r
Failed metric, filter: PF1, r
=======================================================
Comparison against *current development* requirements.
Measured           Required      Passes
PA1 : 18.55 mmag < 25.00 mmag == True
PF1 : 17.14 %    < 30.00 %    == True
PA2 : 28.40 mmag < 40.00 mmag == True
AM1 :  8.02 mas  < 12.00 mas  == True
AF1 :  6.44 %    < 10.00 %    == True
AM2 :  7.41 mas  < 12.00 mas  == True
AF2 :  4.17 %    < 10.00 %    == True
No results available for AM3
No results available for AF3
PASSED.  ALL MEASURED KEY PERFORMANCE METRICS PASSED CURRENT REQUIREMENTS.
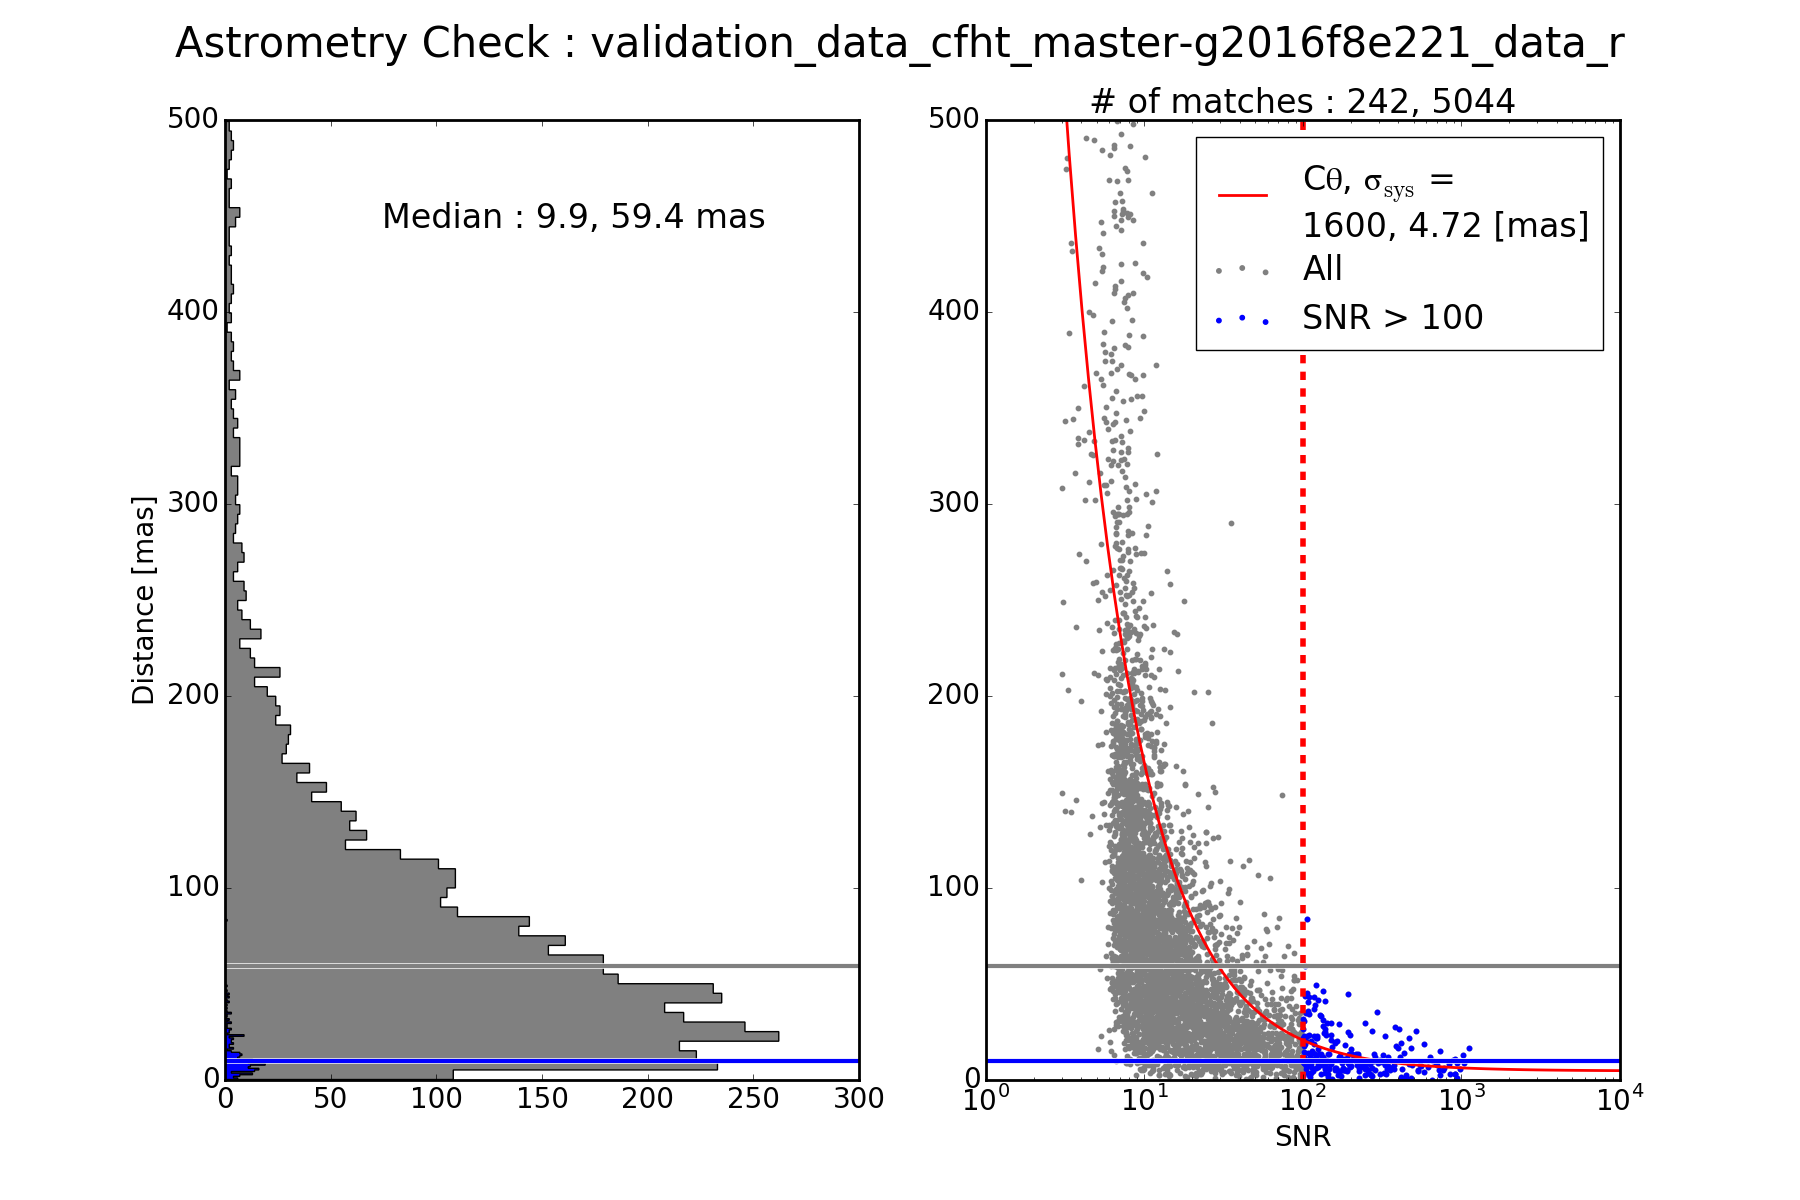
Figure 1 Distribution of the RMS in the measured position of the sources for the same object across visits. The expected astrometric error from a single image is \(C \theta/{\rm SNR}\). Note that we here fit to the joint sample instead of more properly fitting to the seeing in each image.
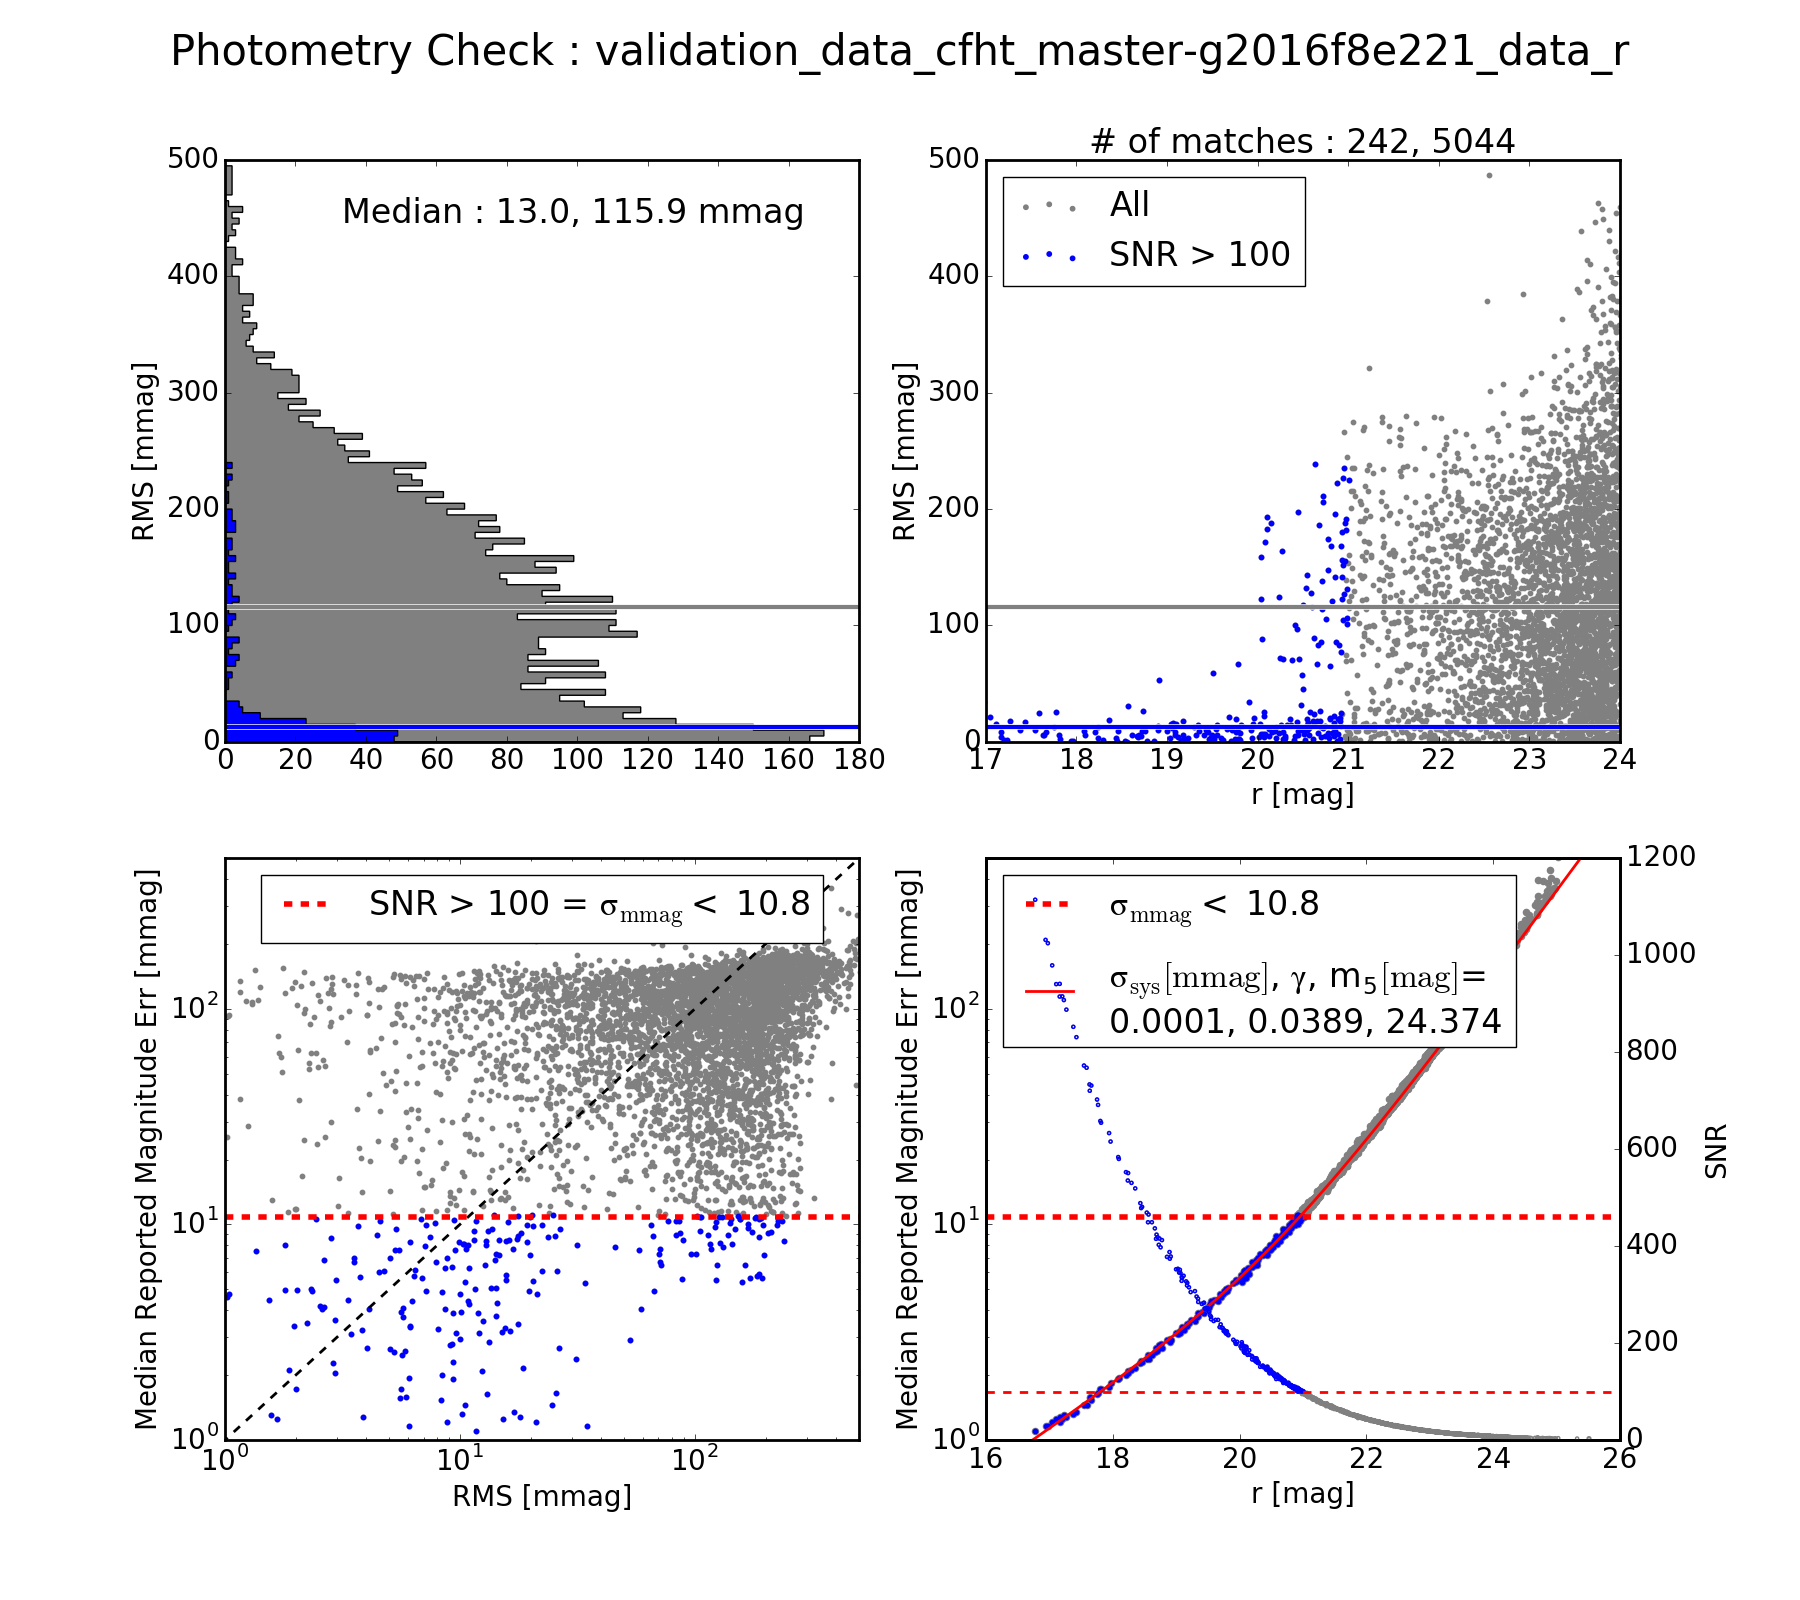
Figure 2 The photometric repeatability in the measured magnitude of the sources for the same object across visits.
Based on base_PsfFlux_flux as calibrated using calexp.calib.
The blue subsample indicates stars with SNR > 100.
The fit photometric error model is from the LSST Overview paper.
(top left) Distribution of RMS for each object.
(top right) RMS vs. mean magnitude.
(bottom left) A comparison of the quoted uncertainty vs. the observe variation (log-log scale in mmag). Quoted magnitude uncertainty from the src file. RMS of quoted magnitude.
(bottom right) Quoted magnitude uncertainty vs. mean magnitude. Fit model for expected behavior for photon Poisson statistics.
These first two figures aren’t actually formal SRD numbers. They are instead the same-object repeatability RMS in the calibrated values of the astrometric position and magnitude.
The next three figures are representations of the formal LSST SRD numbers.
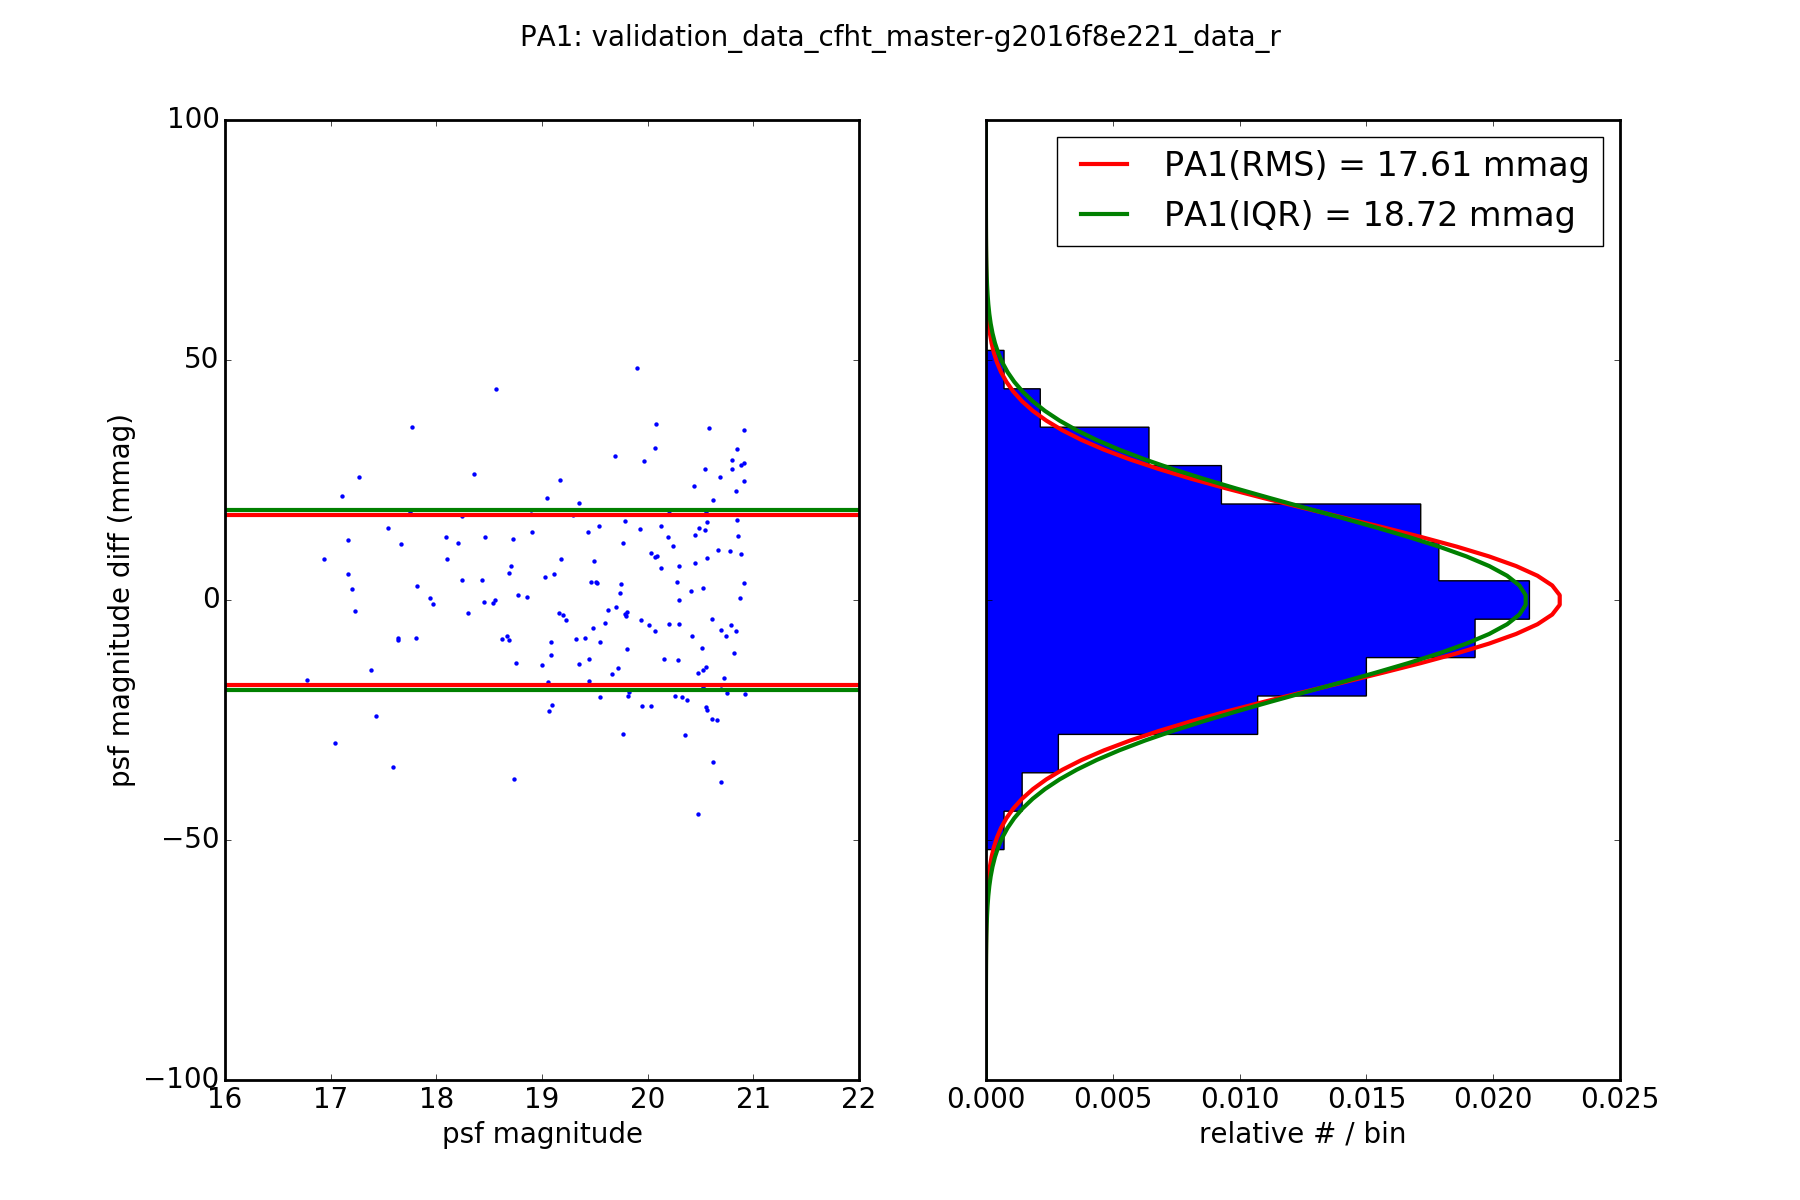
Figure 3 Difference in magnitude between the visits for the stars with SNR > 100. In this example there are only two visits. In general validate_drp considers a random sample of pairs of visits.
The RMS and the inter-quartile range (IQR: 75%-25%) are each computed from the distribution of these differences in magnitudes. The reported IQR is normalized to the same scale as an RMS.
(left) Difference vs. mean magnitude. RMS (red), IQR (green) are shown as horizontal lines.
(right) Distribution of the differences. The RMS (ref) and IQR (green) are visualized as Gaussians with those values.
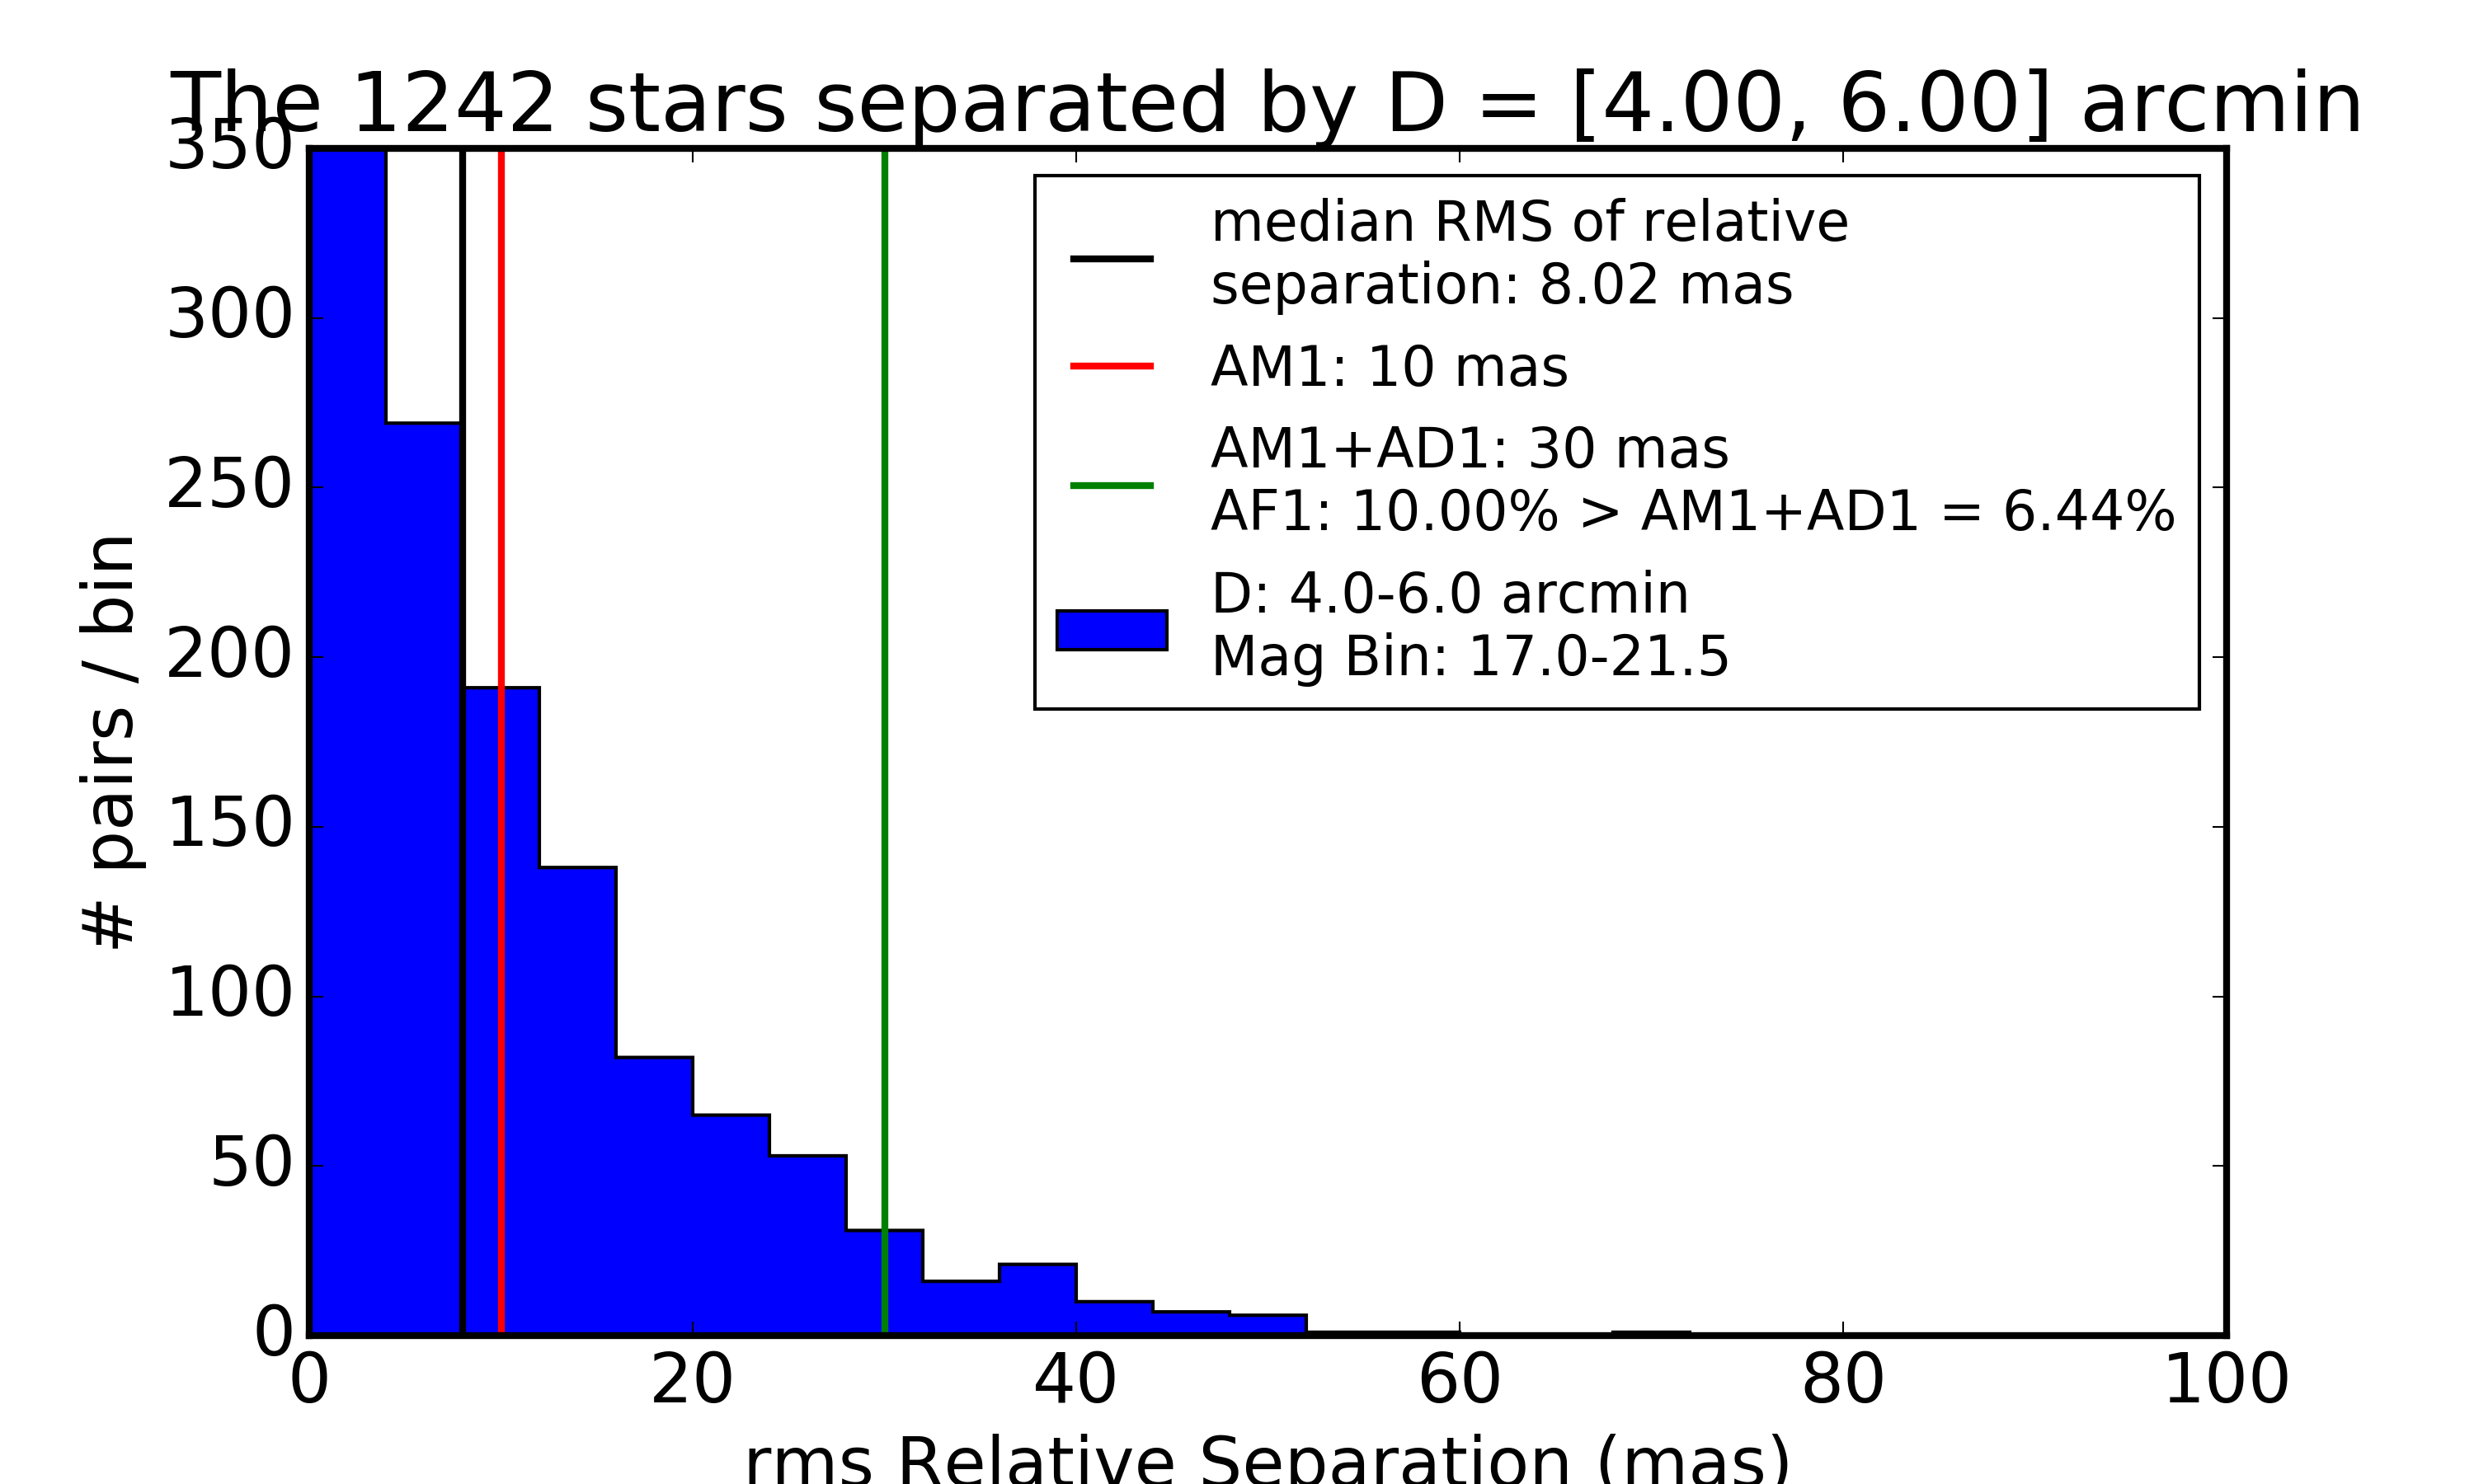
Figure 4 Distribution of the repeatability of astrometric distance between stars separted by 4-6 arcminutes. The SRD spec of AM1=10 mas is shown in red. The SRD spec for the outlier fraction with RMS relative separation of > AM1+AD1=30 mas (green) is 6.44%, which satisfies the “design” specification of AF1=10%.
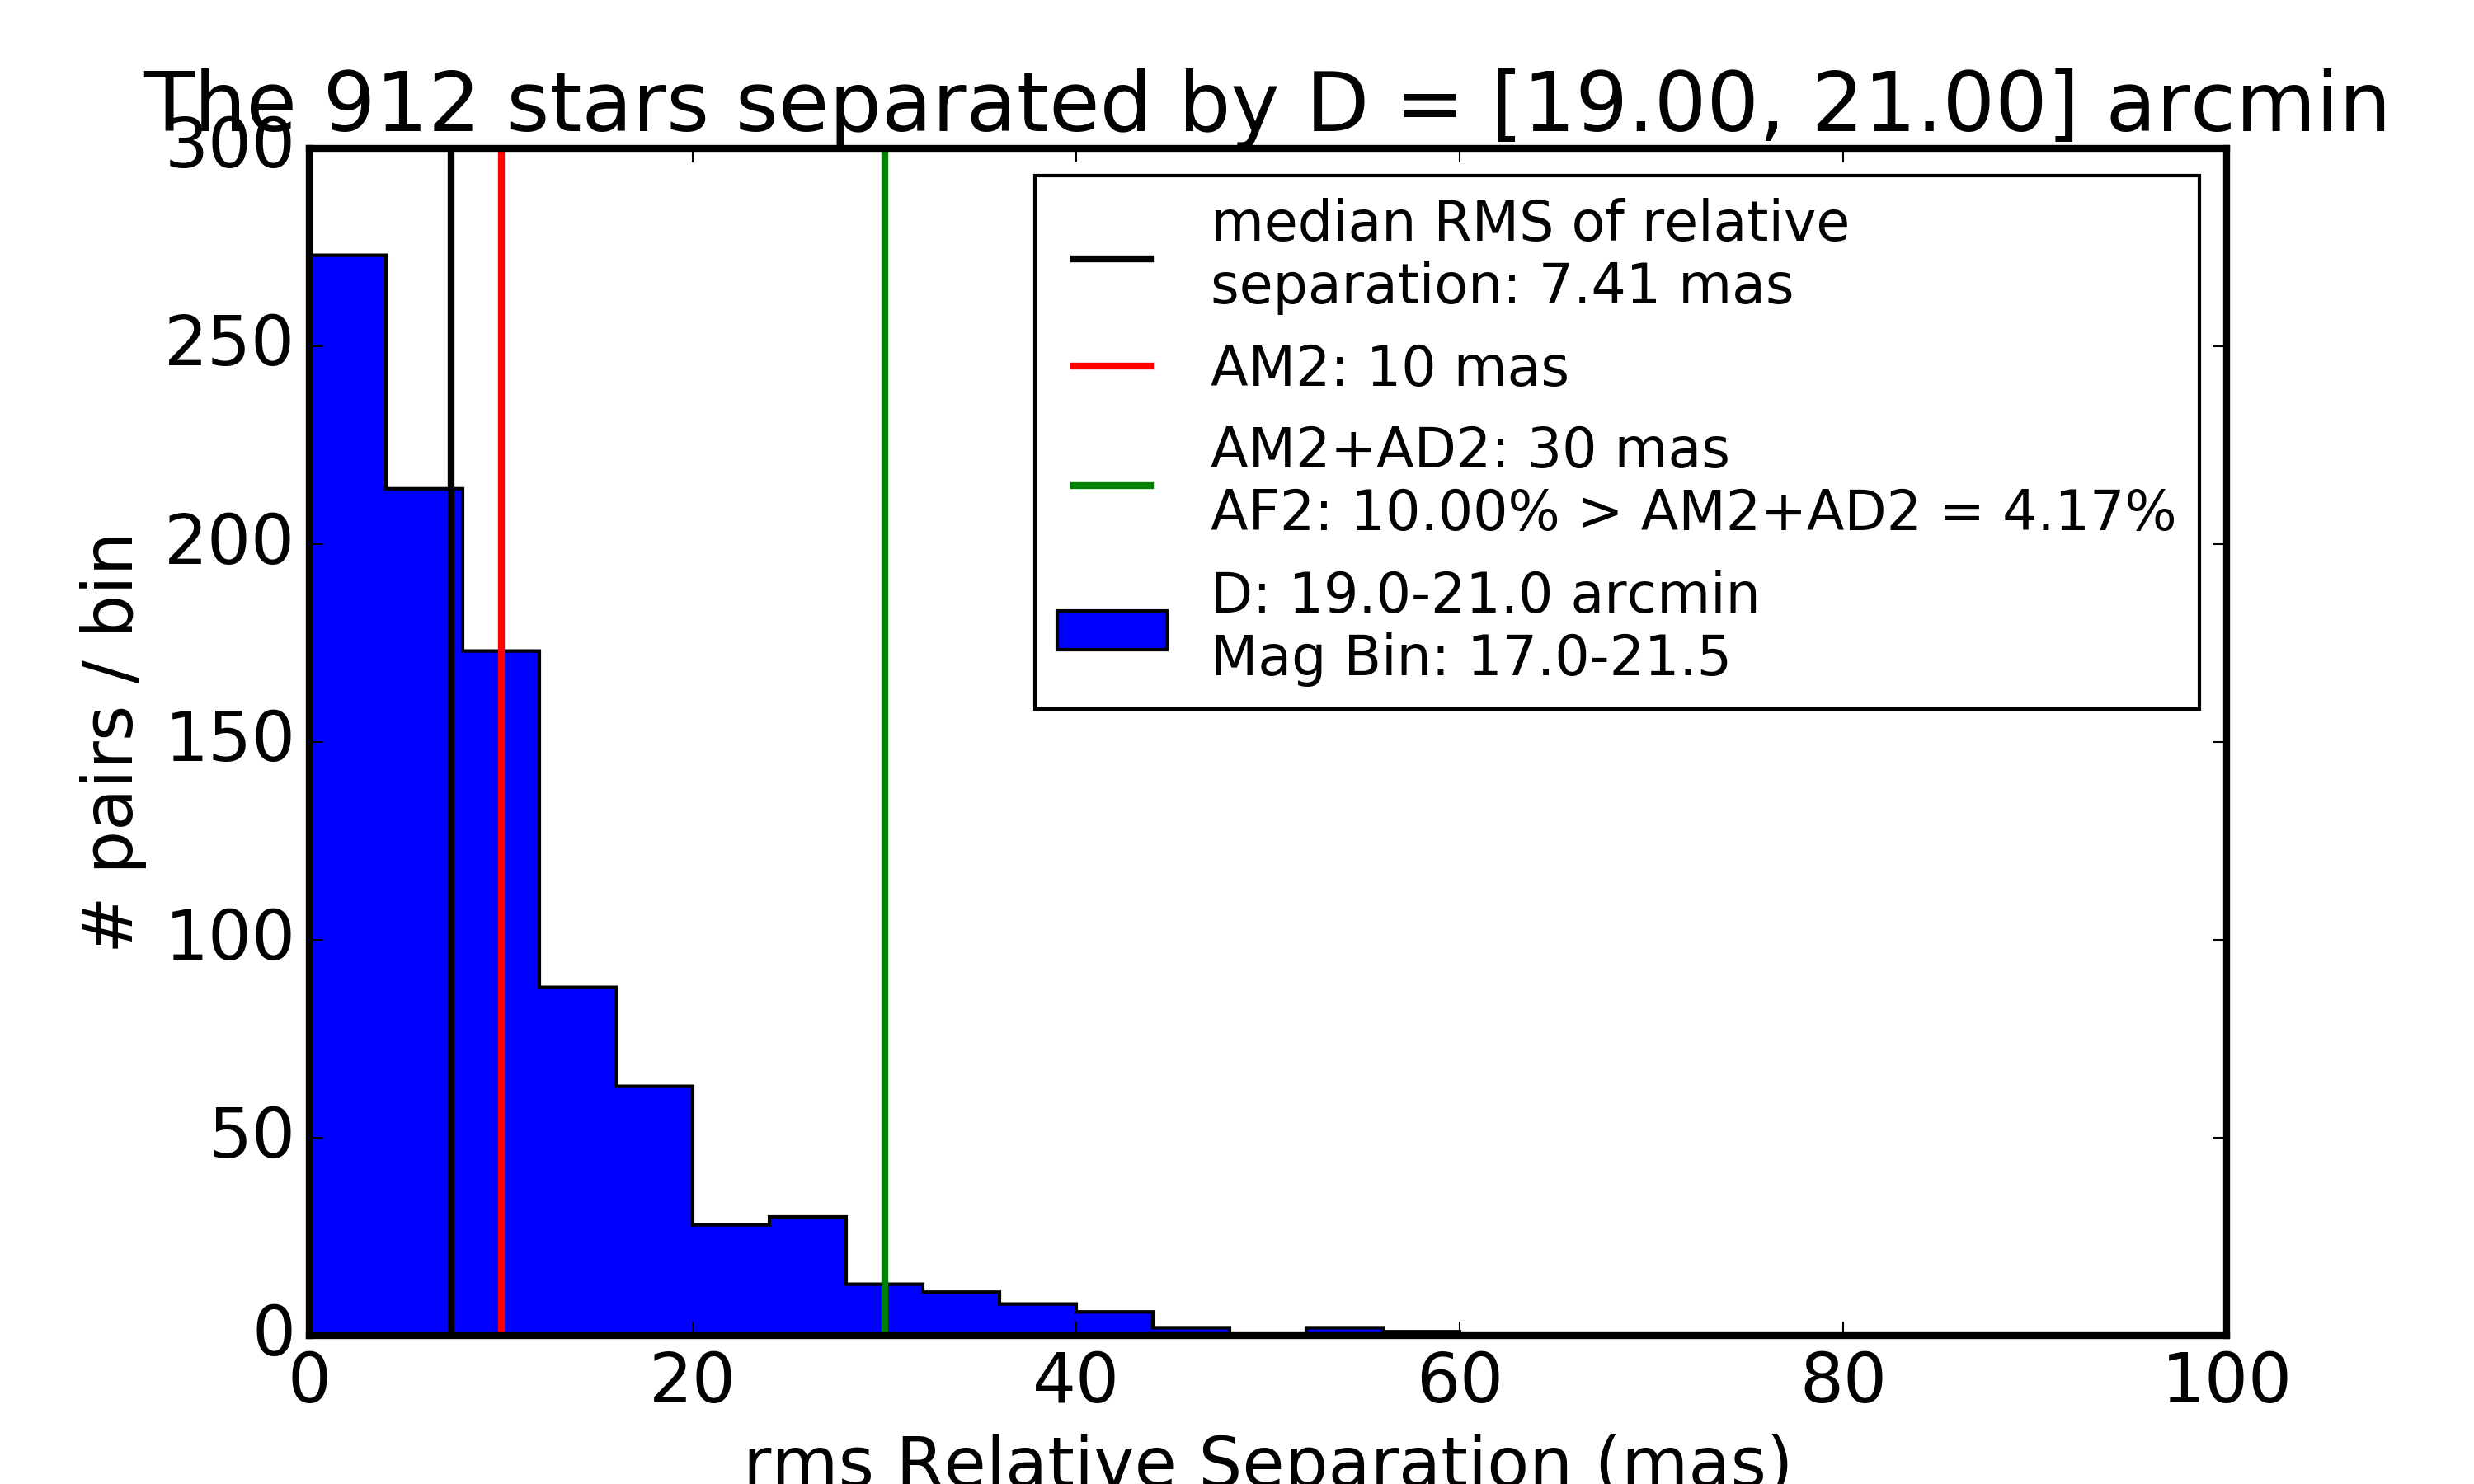
Figure 5 Distribution of the repeatability of astrometric distance between stars separted by 19-21 arcminutes. AM2.
Run on sample DECam data
[...]
Median value of the astrometric scatter - all magnitudes: 72.200 mas
Astrometric scatter (median) - snr > 100.0 : 31.1 mas
Median astrometric scatter 31.1 mas is larger than reference : 25.0 mas
Median value of the photometric scatter - all magnitudes: 81.016 mmag
Photometric scatter (median) - SNR > 100.0 : 41.9 mmag
Median photometric scatter 41.851 mmag is larger than reference : 25.000 mag
[-109.73075605   40.53691056]
$C\theta$, $\sigma_{\rm sys}$ =
-109.7, 40.54 [mas]
[  1.34547321e-02   5.50412642e-02   4.48827416e+01]
$\sigma_{\rm sys} {\rm [mmag]}$, $\gamma$, $m_5 {\rm [mag]}$=
13.4547, 0.0550, 44.883
No stars found that are 199.0--201.0 arcmin apart.
=============================================
Detailed comparison against SRD requirements.
The LSST SRD is at:  http://ls.st/LPM-17
PA1(RMS) = 31.05+-0.00 mmag
PA1(IQR) = 31.36+-0.71 mmag
--
minimum: PF1=20% of diffs more than PA2 = 39.23 mmag (target is < 15 mmag)
design : PF1=10% of diffs more than PA2 = 48.90 mmag (target is < 15 mmag)
stretch: PF1= 5% of diffs more than PA2 = 58.76 mmag (target is < 10 mmag)
--
minimum: PF1=28% of diffs more than PA2 = 15.00 mmag (target is < 20 %)
design : PF1=28% of diffs more than PA2 = 15.00 mmag (target is < 10 %)
stretch: PF1=36% of diffs more than PA2 = 10.00 mmag (target is <  5 %)
--
Median RMS of distances between pairs of stars.
  DESIGN goals
  For stars from 17.00 < mag < 21.50 and D = [4.00, 6.00] arcmin
AM1=28.00 mas (target is < 10 mas).
  46.38% of sample deviates by >30 mas (target is < 10%)
--
Median RMS of distances between pairs of stars.
  DESIGN goals
  For stars from 17.00 < mag < 21.50 and D = [19.00, 21.00] arcmin
AM2=26.63 mas (target is < 10 mas).
  45.87% of sample deviates by >30 mas (target is < 10%)
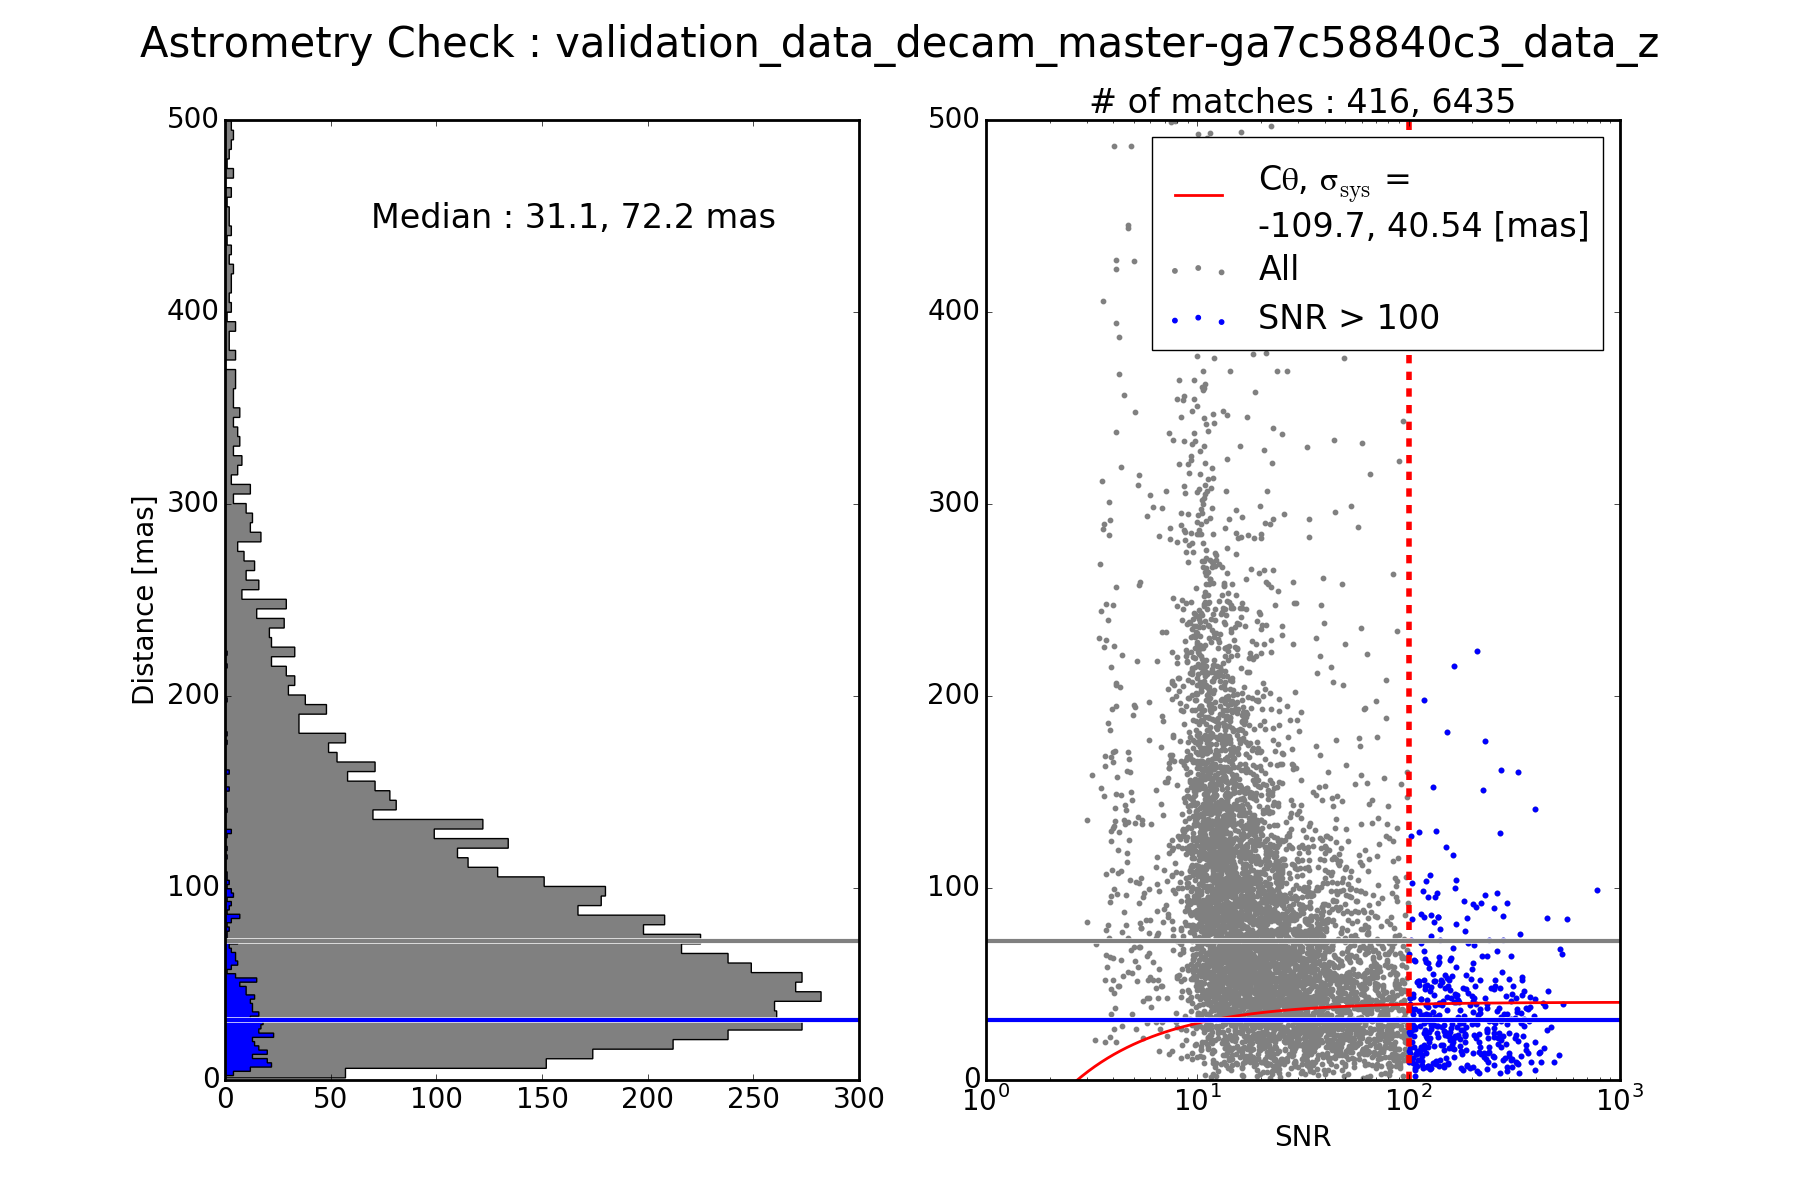
Figure 6 Distribution of the RMS in the measured position of the sources for the same object across visits. The expected astrometric error from a single image is \(C \theta/{\rm SNR}\). Note that we here fit to the joint sample instead of more properly fitting to the seeing in each image. Also note that the fit is terrible.
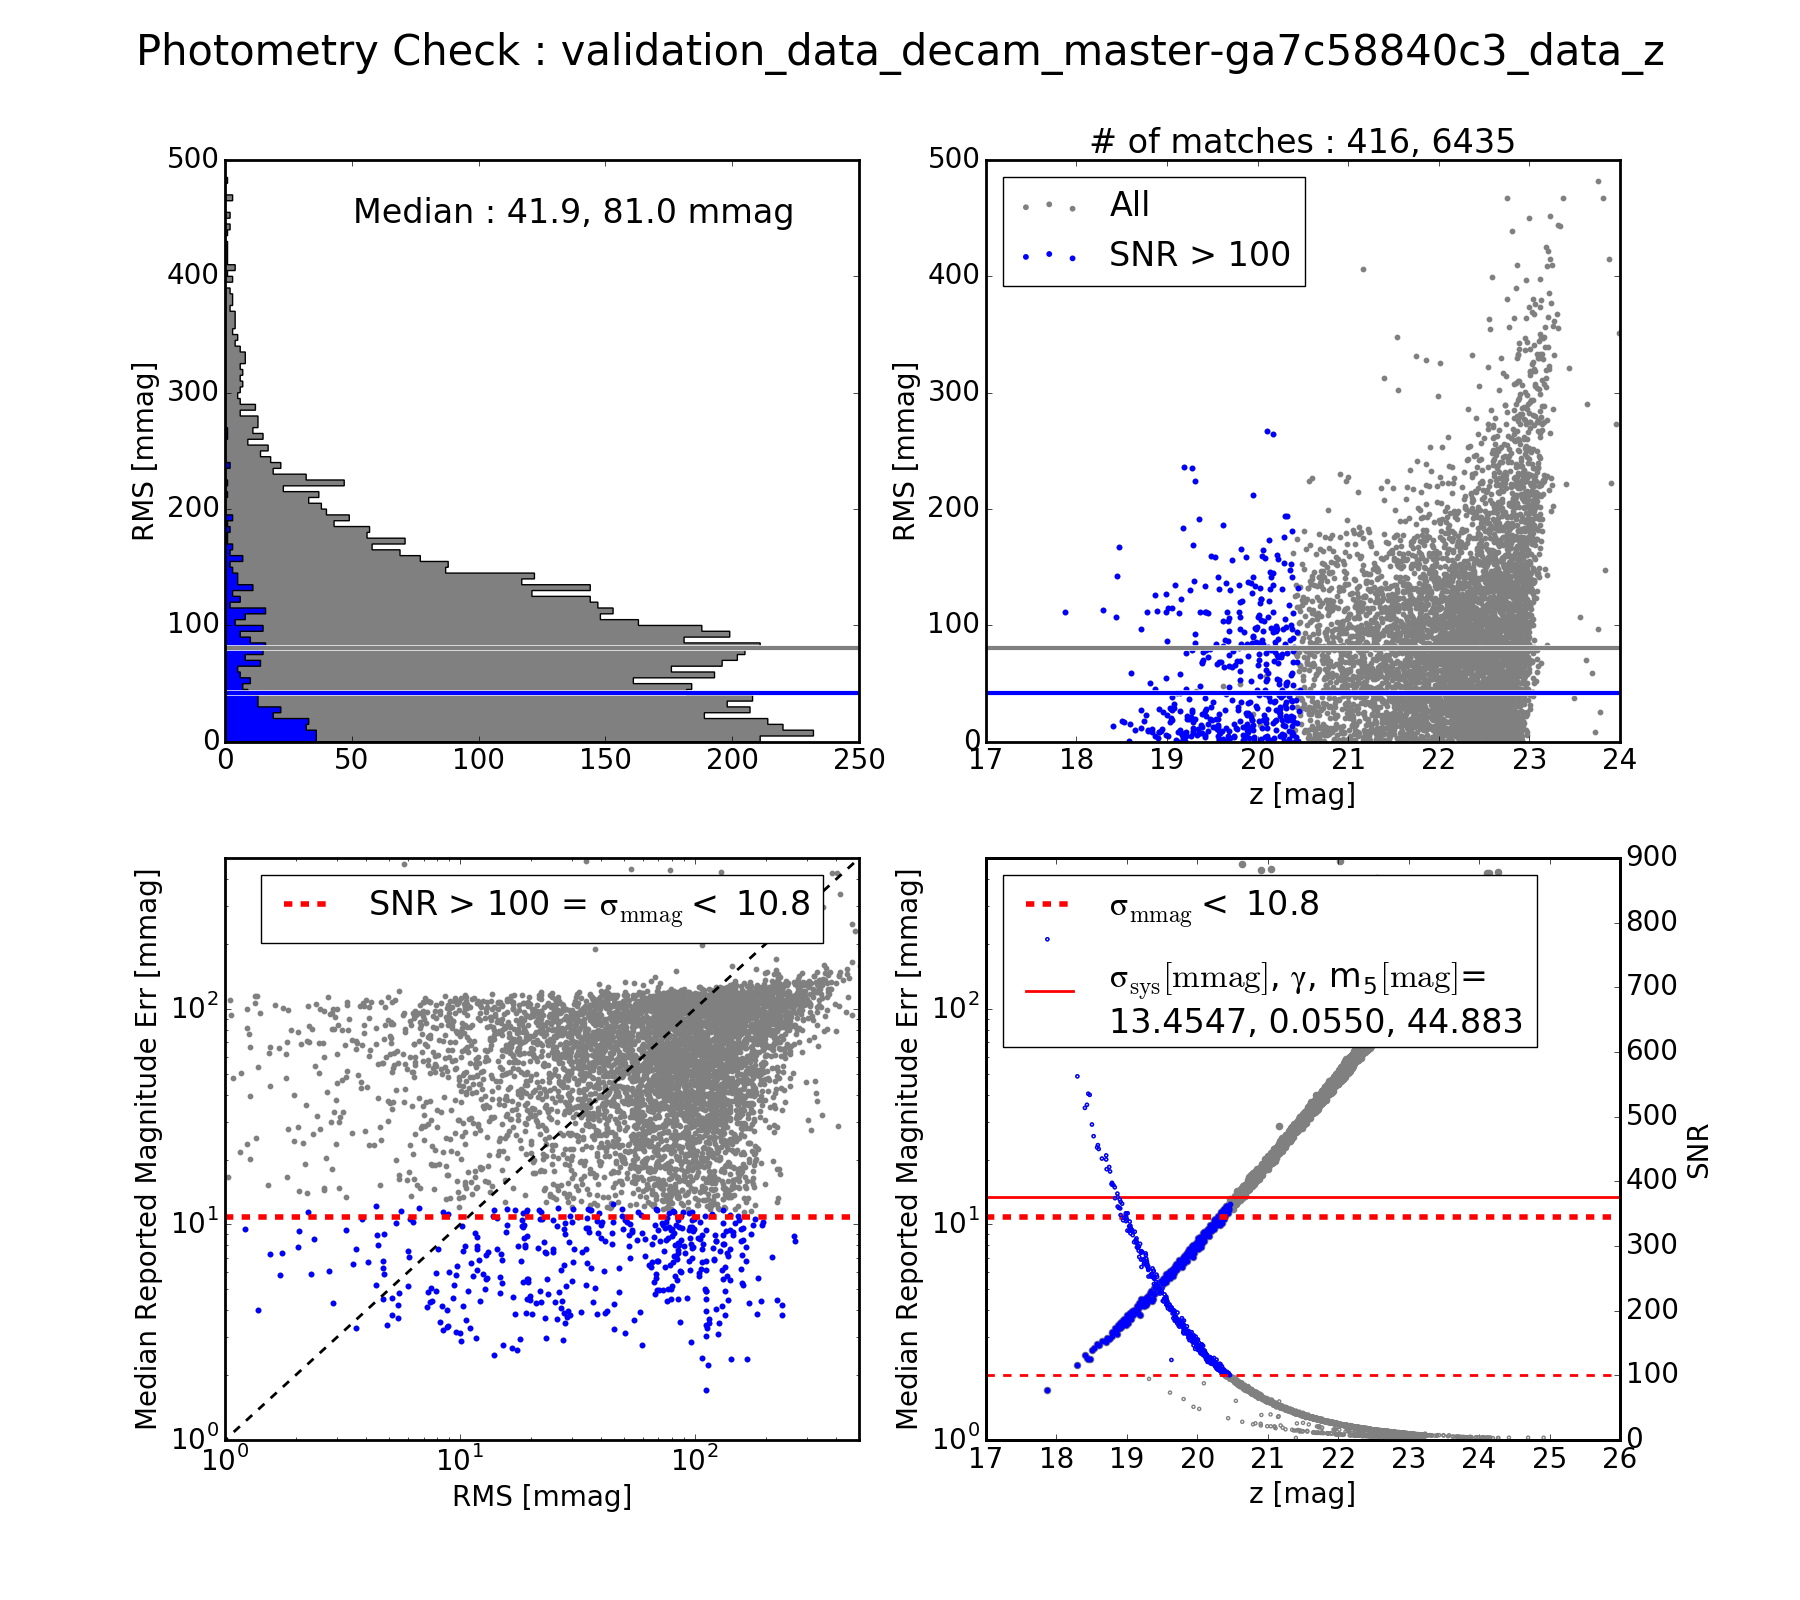
Figure 7 The photometric repeatability in the measured magnitude of the sources for the same object across visits.
Based on base_PsfFlux_flux as calibrated using calexp.calib.
The blue subsample indicates stars with SNR > 100.
src file. RMS of quoted magnitude.
(bottom right) Quoted magnitude uncertainty vs. mean magnitude. Fit model for expected behavior for photon Poisson statistics.
Note that the fit is terrible.These first two figures aren’t actually formal SRD numbers. They are instead the same-object repeatability RMS in the calibrated values of the astrometric position and magnitude.
The next three figures are representations of the formal LSST SRD numbers.
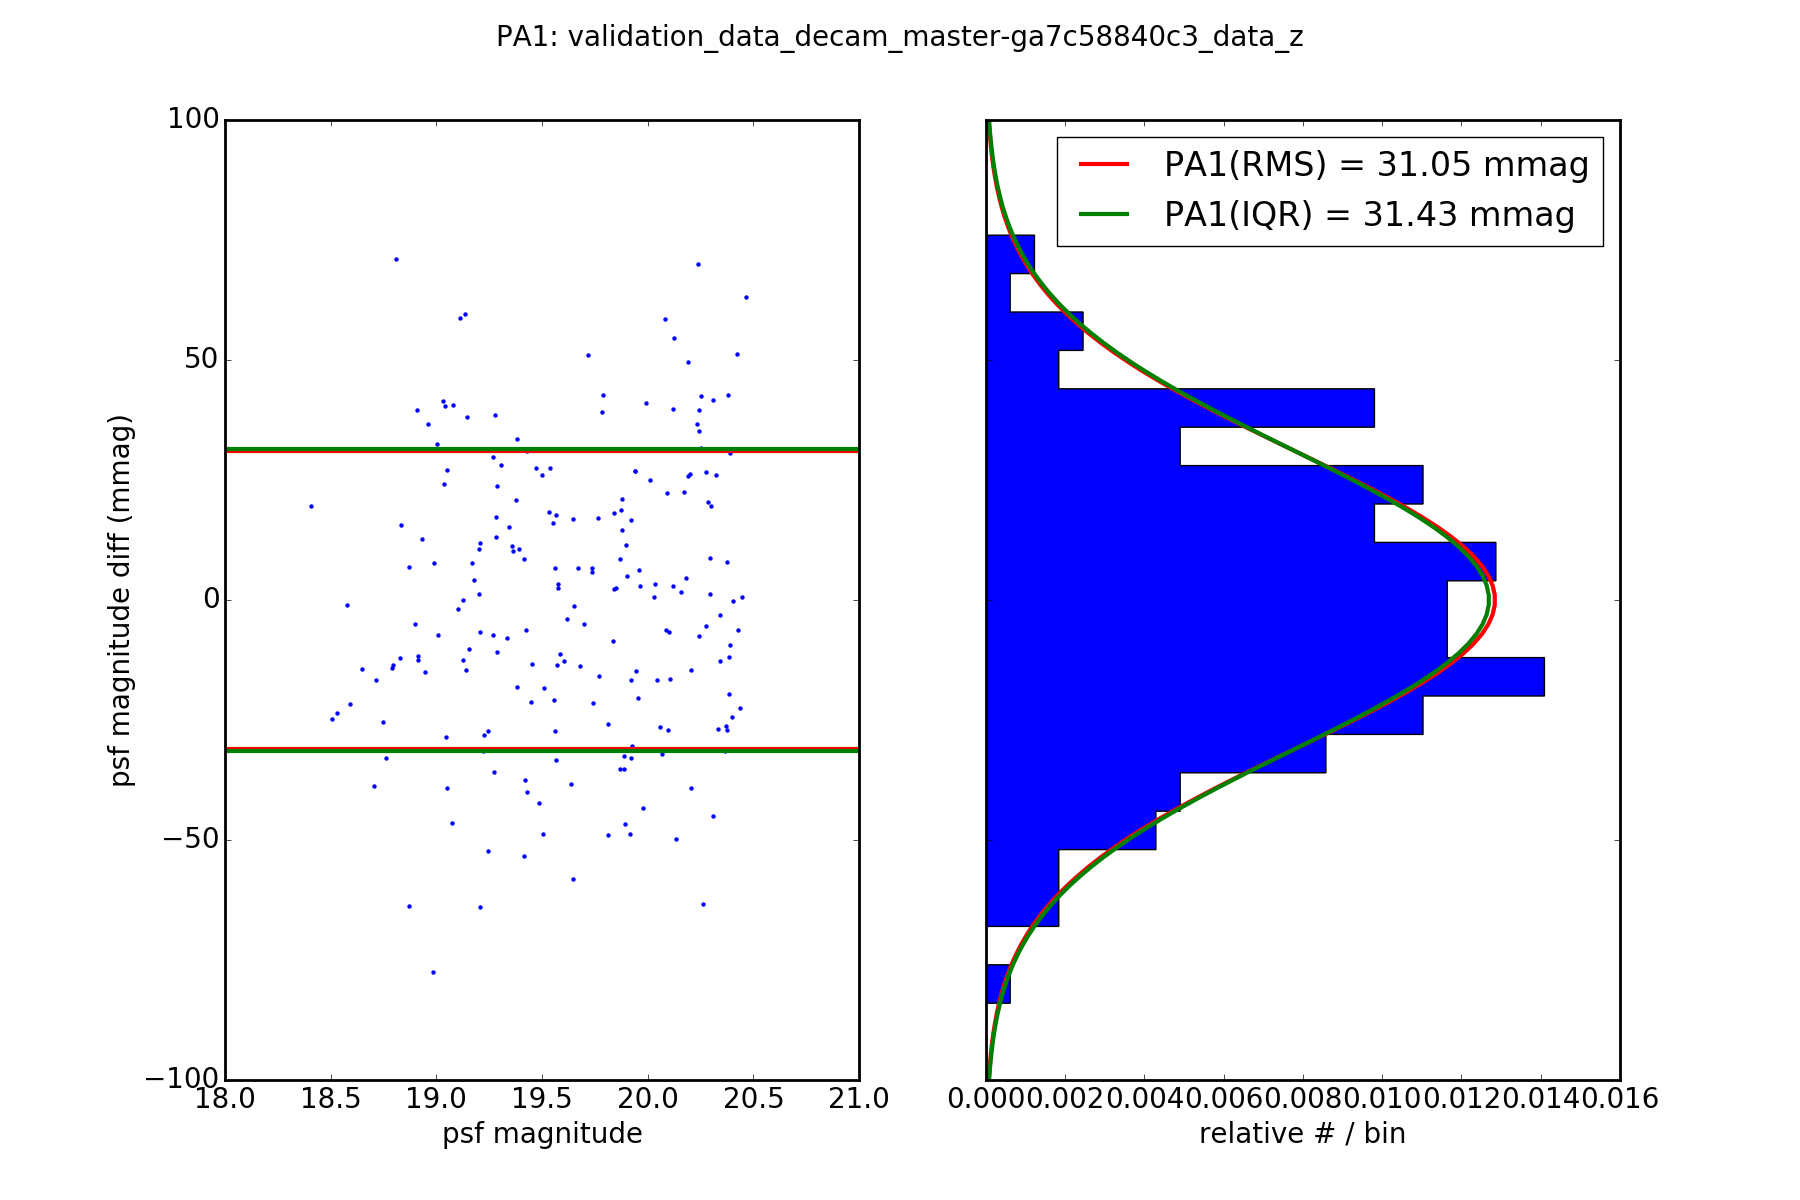
Figure 8 Difference in magnitude between the visits for the stars between 17–21.5 mag. In this example there are only two visits. In general validate_drp considers a random sample of pairs of visits.
The RMS and the inter-quartile range (IQR: 75%-25%) are each computed from the distribution of these differences in magnitudes. The reported IQR is normalized to the same scale as an RMS.
(left) Difference vs. mean magnitude. RMS (red), IQR (green) are shown as horizontal lines.
(right) Distribution of the idfferences. The RMS (ref) and IQR (green) are visualized as Gaussians with those values.
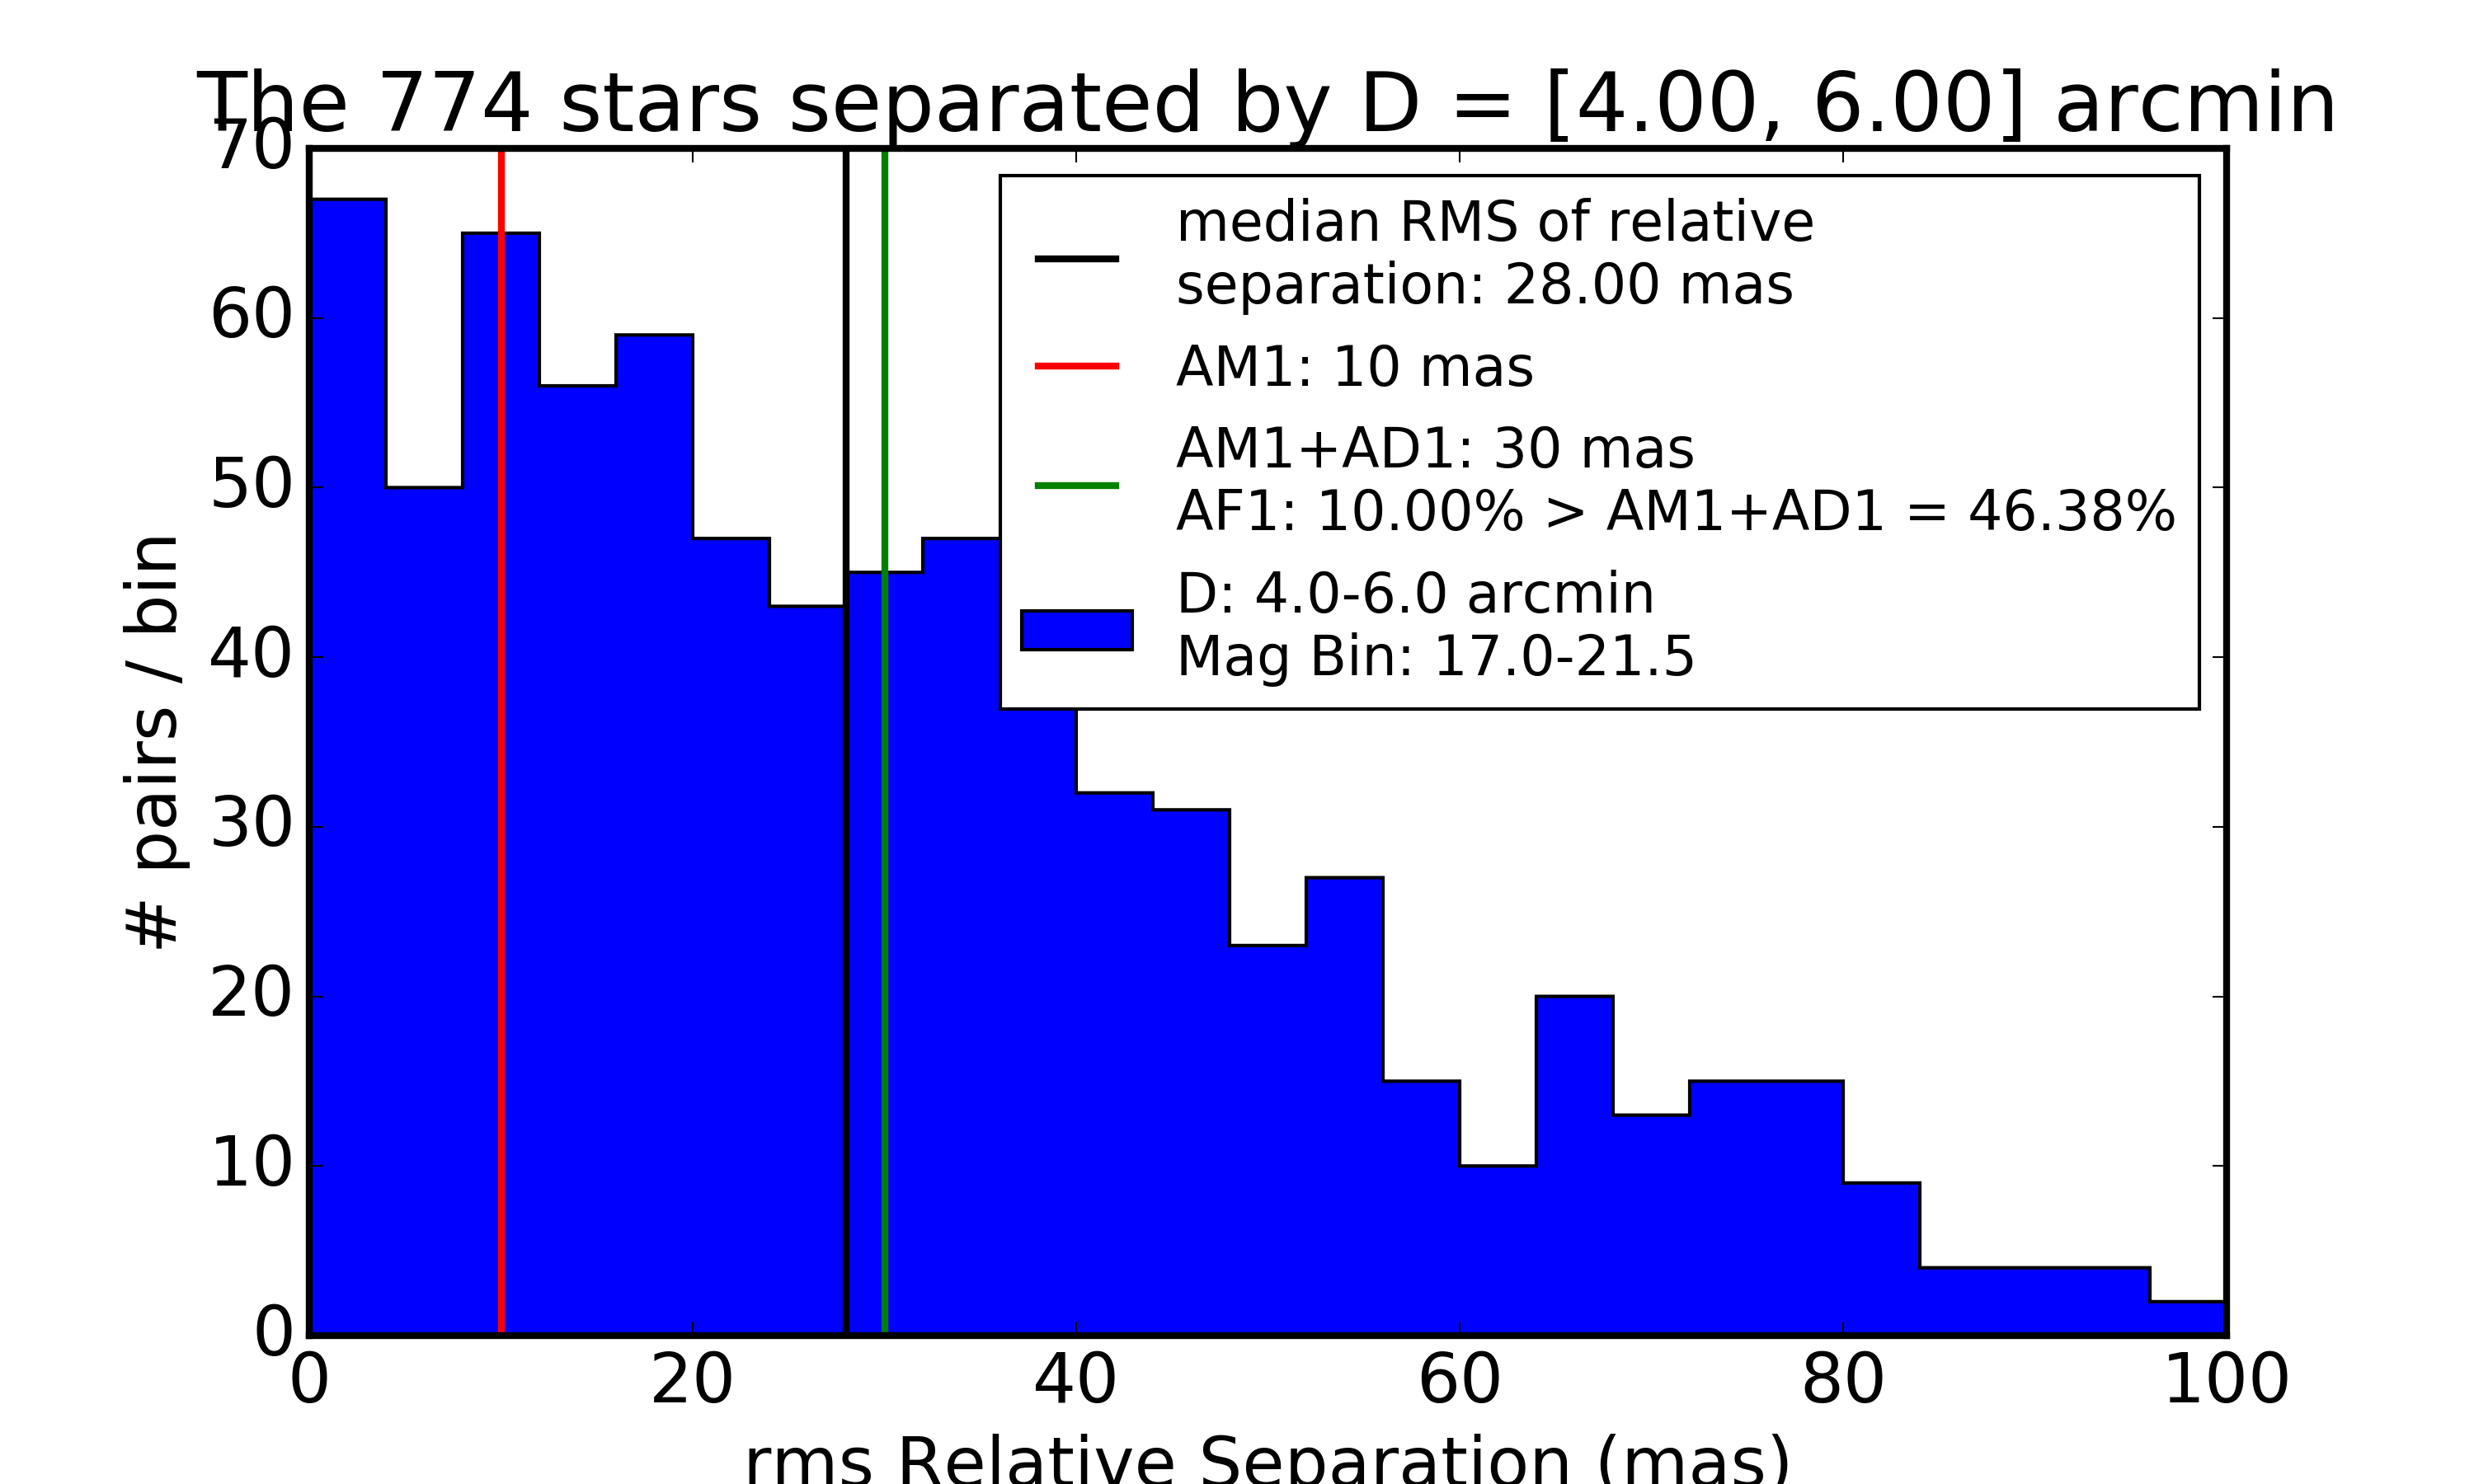
Figure 9 Distribution of the repeatability of astrometric distance between stars separted by 4-6 arcminutes. The SRD spec of AM1=10 mas is shown in red. The performance of 28.00 mas is shown in black. The SRD spec for the outlier fraction with RMS relative separation of > AM1+AD1=30 mas (green) is 46.38%, which is catastrophically above the “design” specification of AF1=10%.
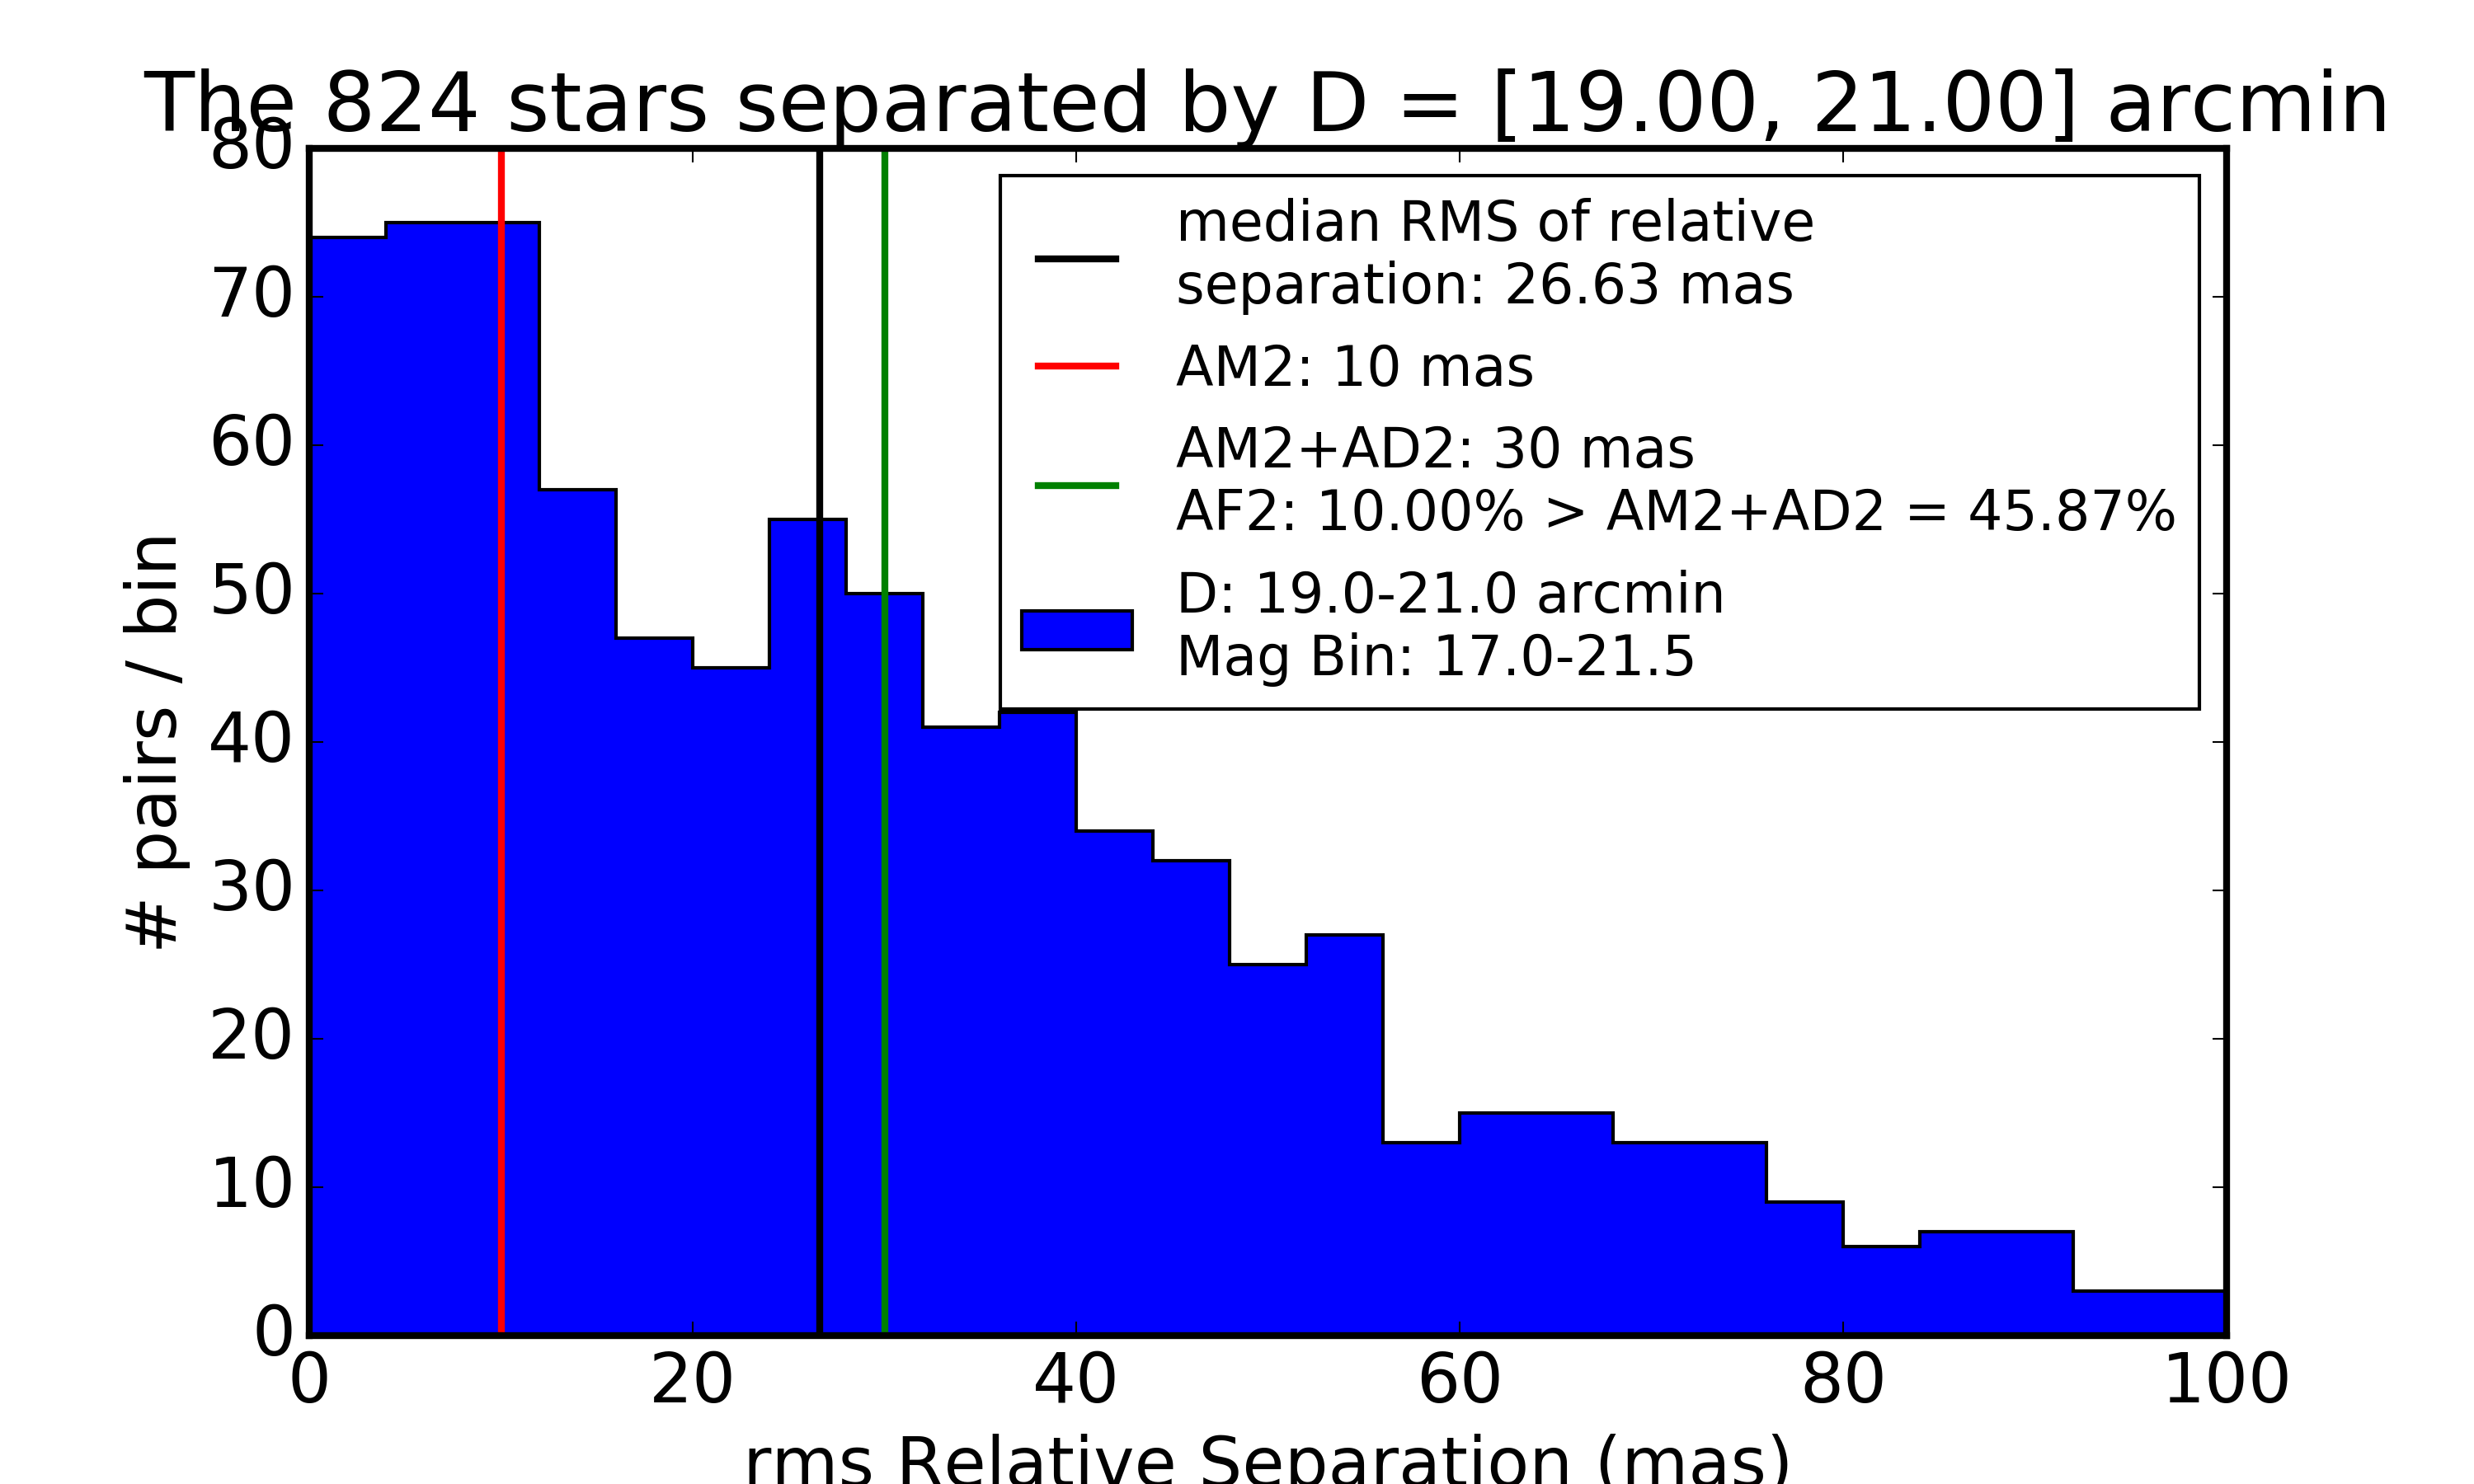
Figure 10 Distribution of the repeatability of astrometric distance between stars separted by 19-21 arcminutes. AM2.
Run on sample HSC data
setup obs_subaru
setup validation_data_hsc
setup validate_drp
validateDrp.py ${VALIDATION_DATA_HSC_DIR}/DATA
Just showing here the results from the i-band (“HSC-I”) processing:
[...]
Median value of the astrometric scatter - all magnitudes: 62.077 mas
Astrometric scatter (median) - snr > 100.0 : 16.0 mas
Median value of the photometric scatter - all magnitudes: 49.789 mmag
Photometric scatter (median) - SNR > 100.0 : 11.6 mmag
No stars found that are 199.0--201.0 arcmin apart.
=============================================
Detailed comparison against SRD requirements.
The LSST SRD is at:  http://ls.st/LPM-17
PA1(RMS) = 19.10+-0.50 mmag
PA1(IQR) = 14.93+-0.77 mmag
--
minimum: PF1=20% of diffs more than PA2 = 20.84 mmag (target is < 15 mmag)
design : PF1=10% of diffs more than PA2 = 27.29 mmag (target is < 15 mmag)
stretch: PF1= 5% of diffs more than PA2 = 37.02 mmag (target is < 10 mmag)
--
minimum: PF1=15% of diffs more than PA2 = 15.00 mmag (target is < 20 %)
design : PF1=15% of diffs more than PA2 = 15.00 mmag (target is < 10 %)
stretch: PF1=23% of diffs more than PA2 = 10.00 mmag (target is <  5 %)
--
Median RMS of distances between pairs of stars.
  DESIGN goals
  For stars from 17.00 < mag < 21.50 and D = [4.00, 6.00] arcmin
AM1=11.09 mas (target is < 10 mas).
  18.88% of sample deviates by >30 mas (target is < 10%)
--
Median RMS of distances between pairs of stars.
  DESIGN goals
  For stars from 17.00 < mag < 21.50 and D = [19.00, 21.00] arcmin
AM2=10.40 mas (target is < 10 mas).
  20.00% of sample deviates by >30 mas (target is < 10%)
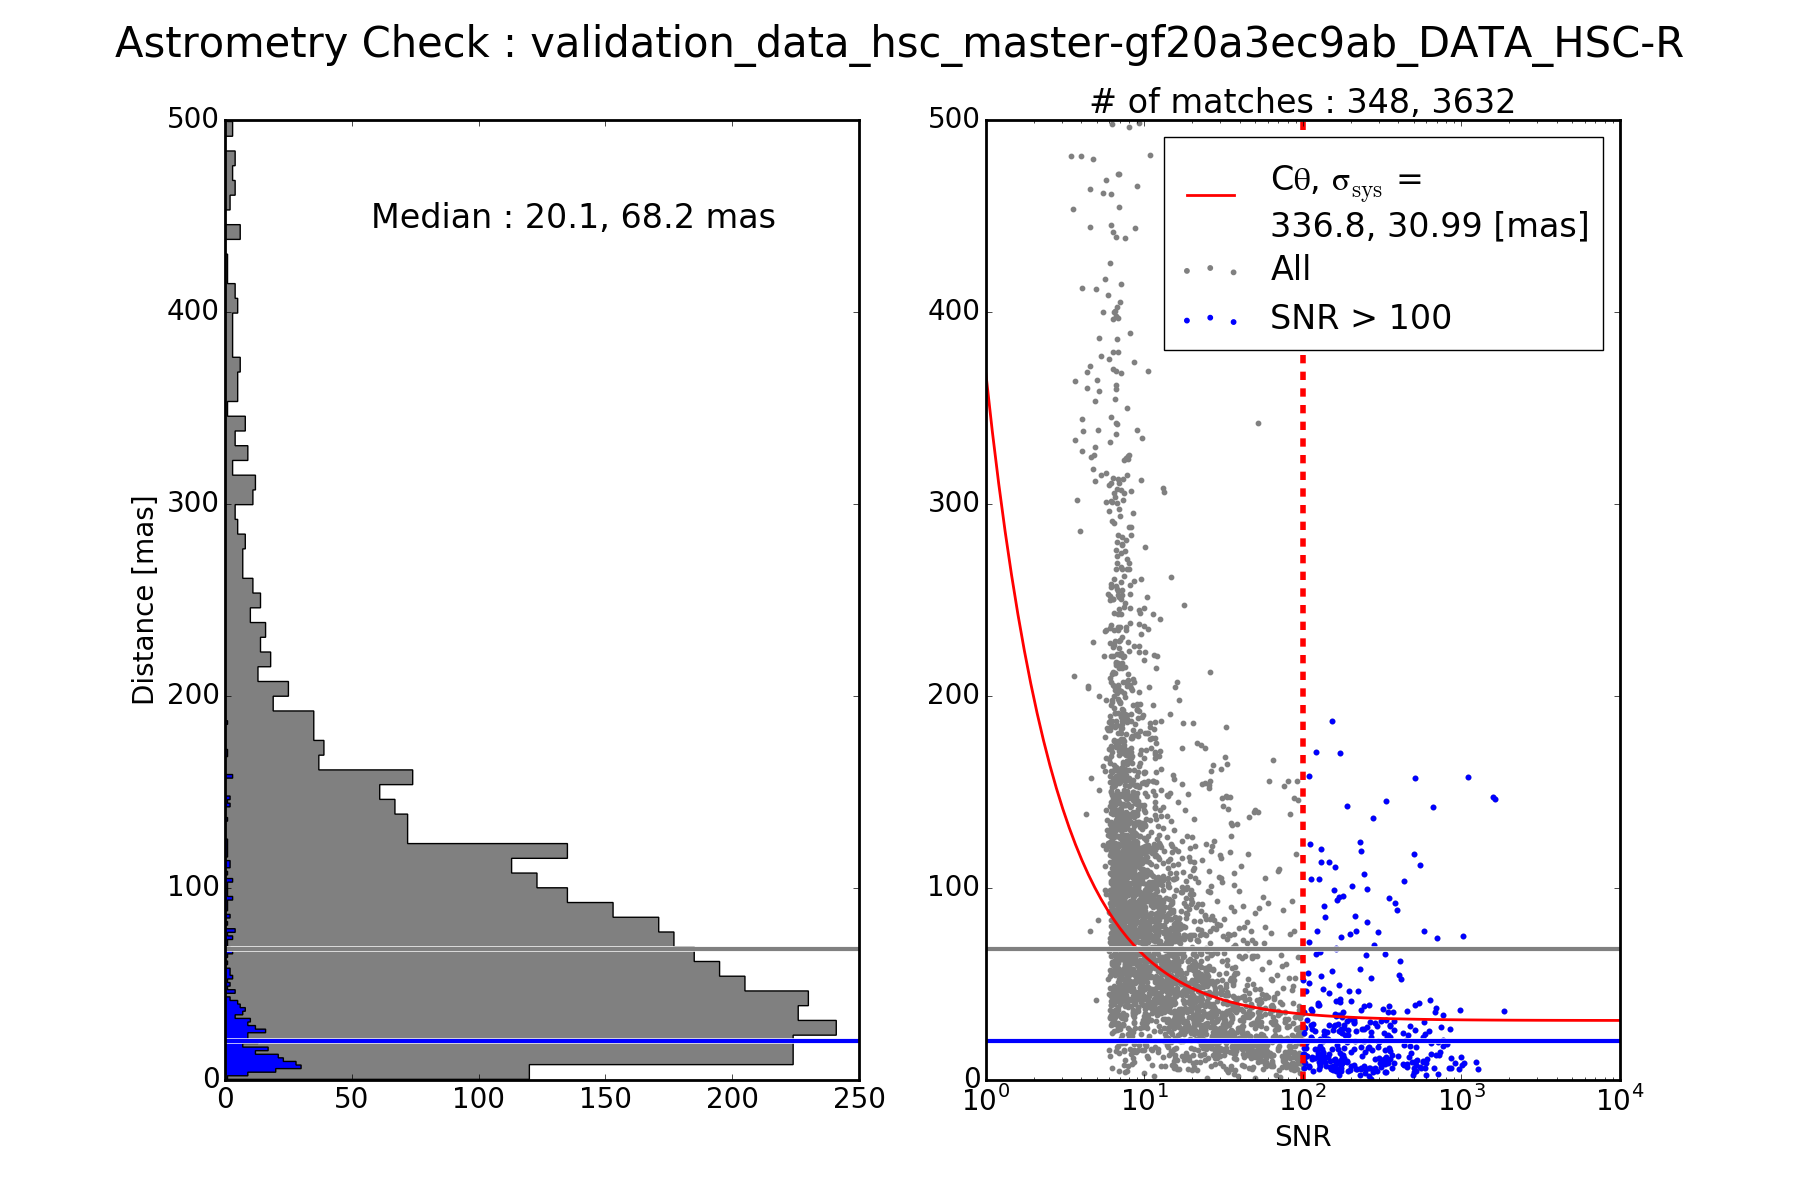
Figure 11 Distribution of the r-band RMS in the measured position of the sources for the same object across visits.
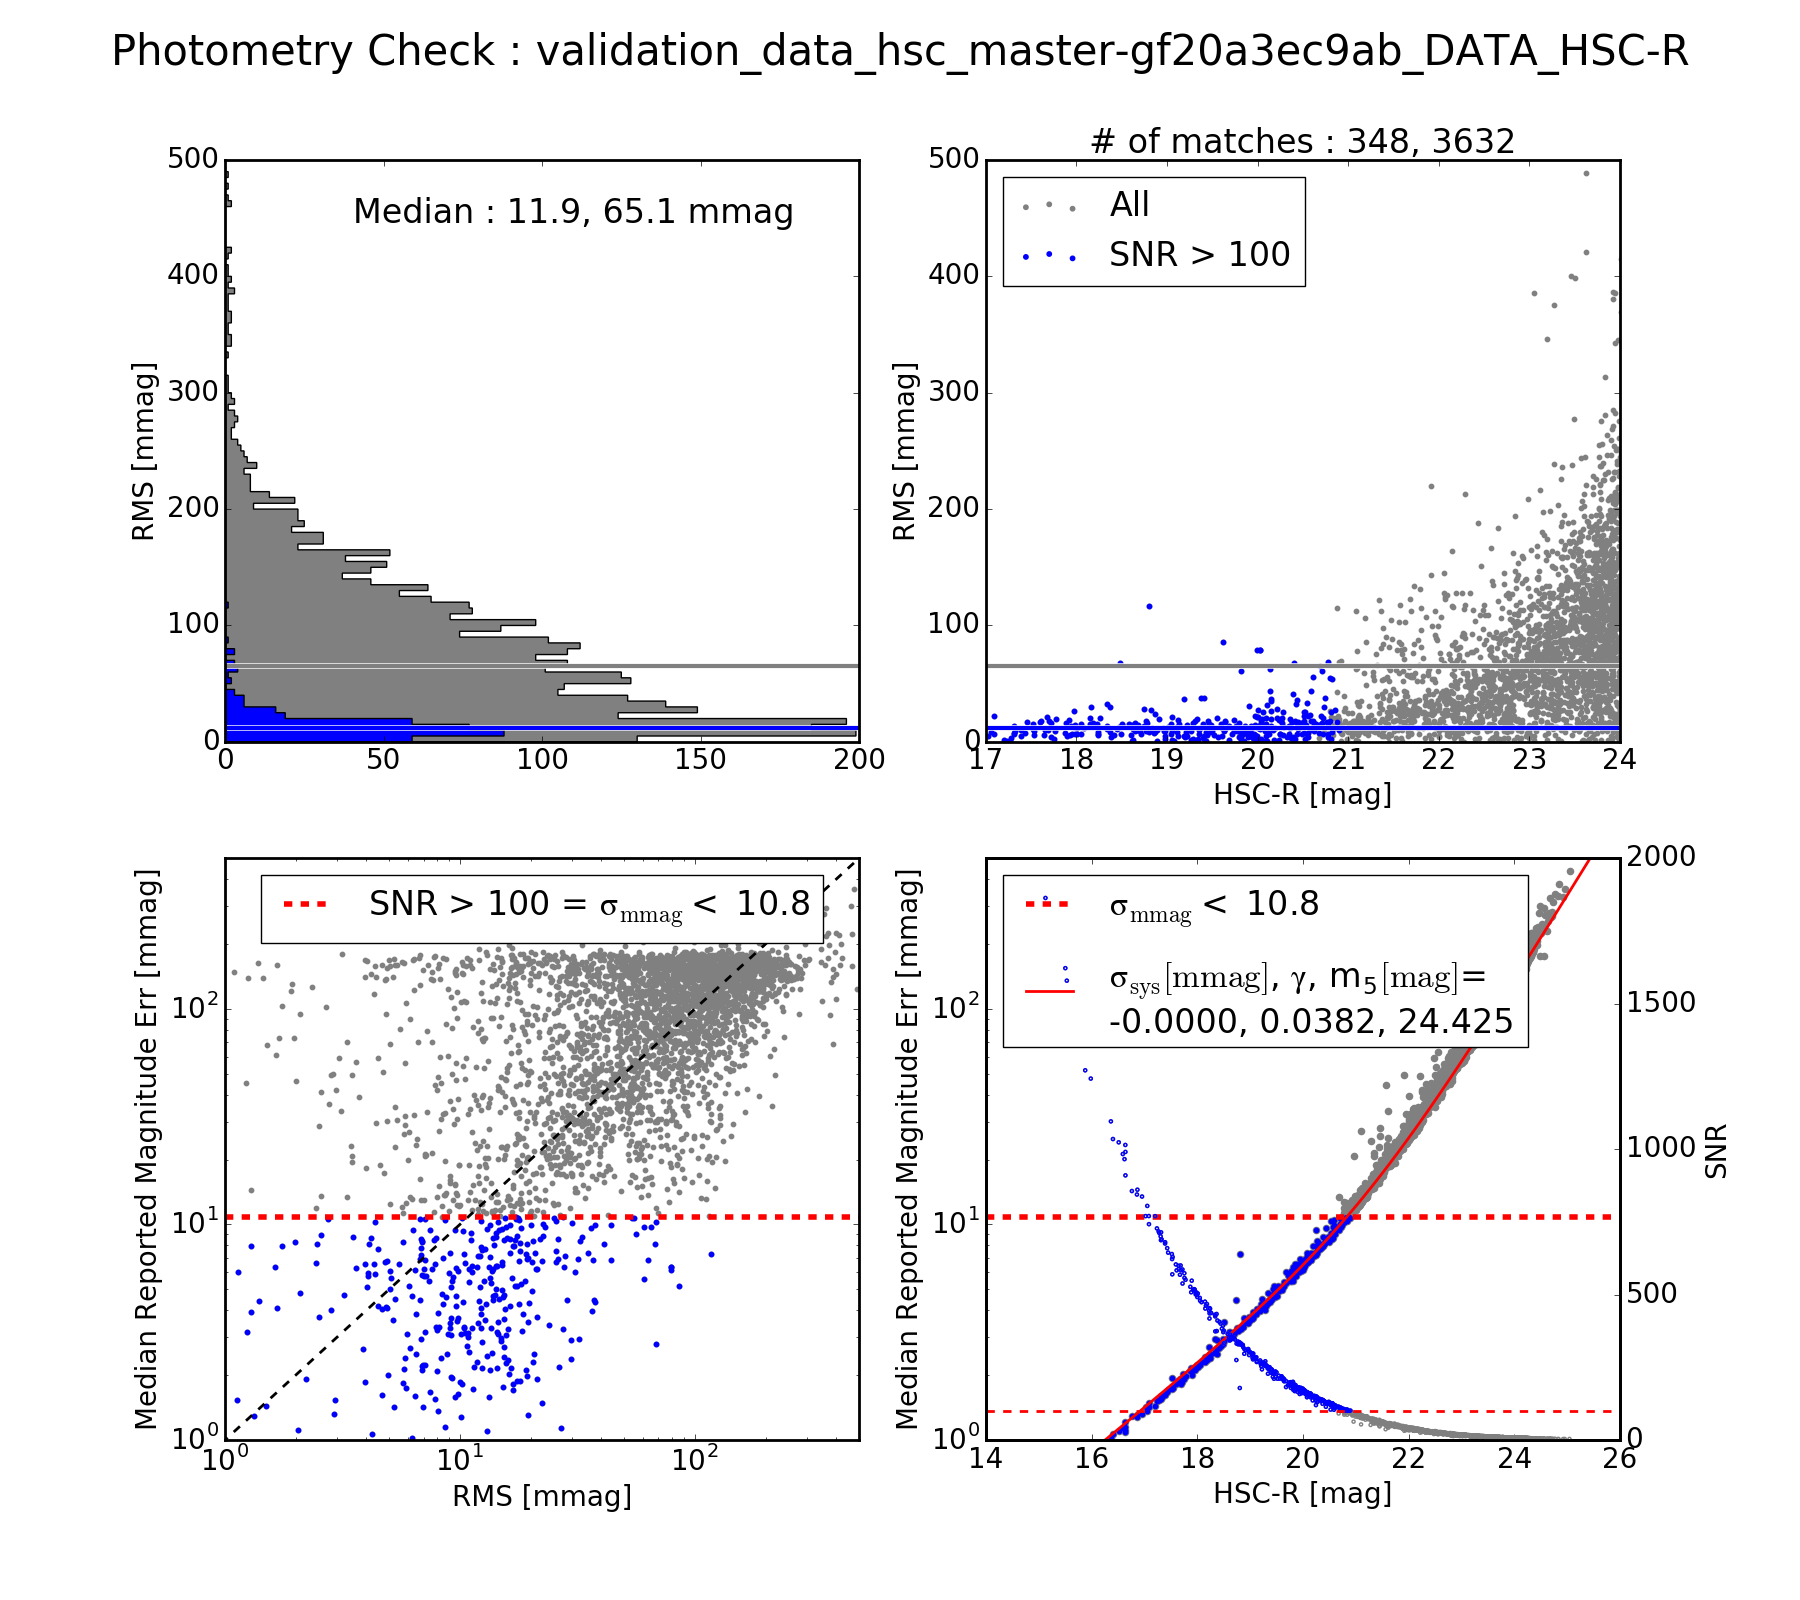
Figure 12 The photometric repeatability in the measured magnitude of the sources for the same object across visits.
Based on base_PsfFlux_flux as calibrated using calexp.calib.
The blue subsample indicates stars with SNR > 100.
src file. RMS of quoted magnitude.
(bottom right) Quoted magnitude uncertainty vs. mean magnitude. Fit model for expected behavior for photon Poisson statistics.These first two figures aren’t actually formal SRD numbers. They are instead the same-object repeatability RMS in the calibrated values of the astrometric position and magnitude.
Note that the astrometric and photometric error models are formally valid for individual images. However, they are being applied here to the results from the set of images, which is implicitly looking at some sort of mean performance. E.g., the expected astrometric uncertainty is intimately related to the seeing of the image. For collections of images where most have a similar seeing, these estimates are useful and reasonable. However, if the data set analyzed consisted of a set of images distributed across a wide range of seeing values, then the fits here have less direct meaning.
The next three figures are representations of the formal LSST SRD numbers.
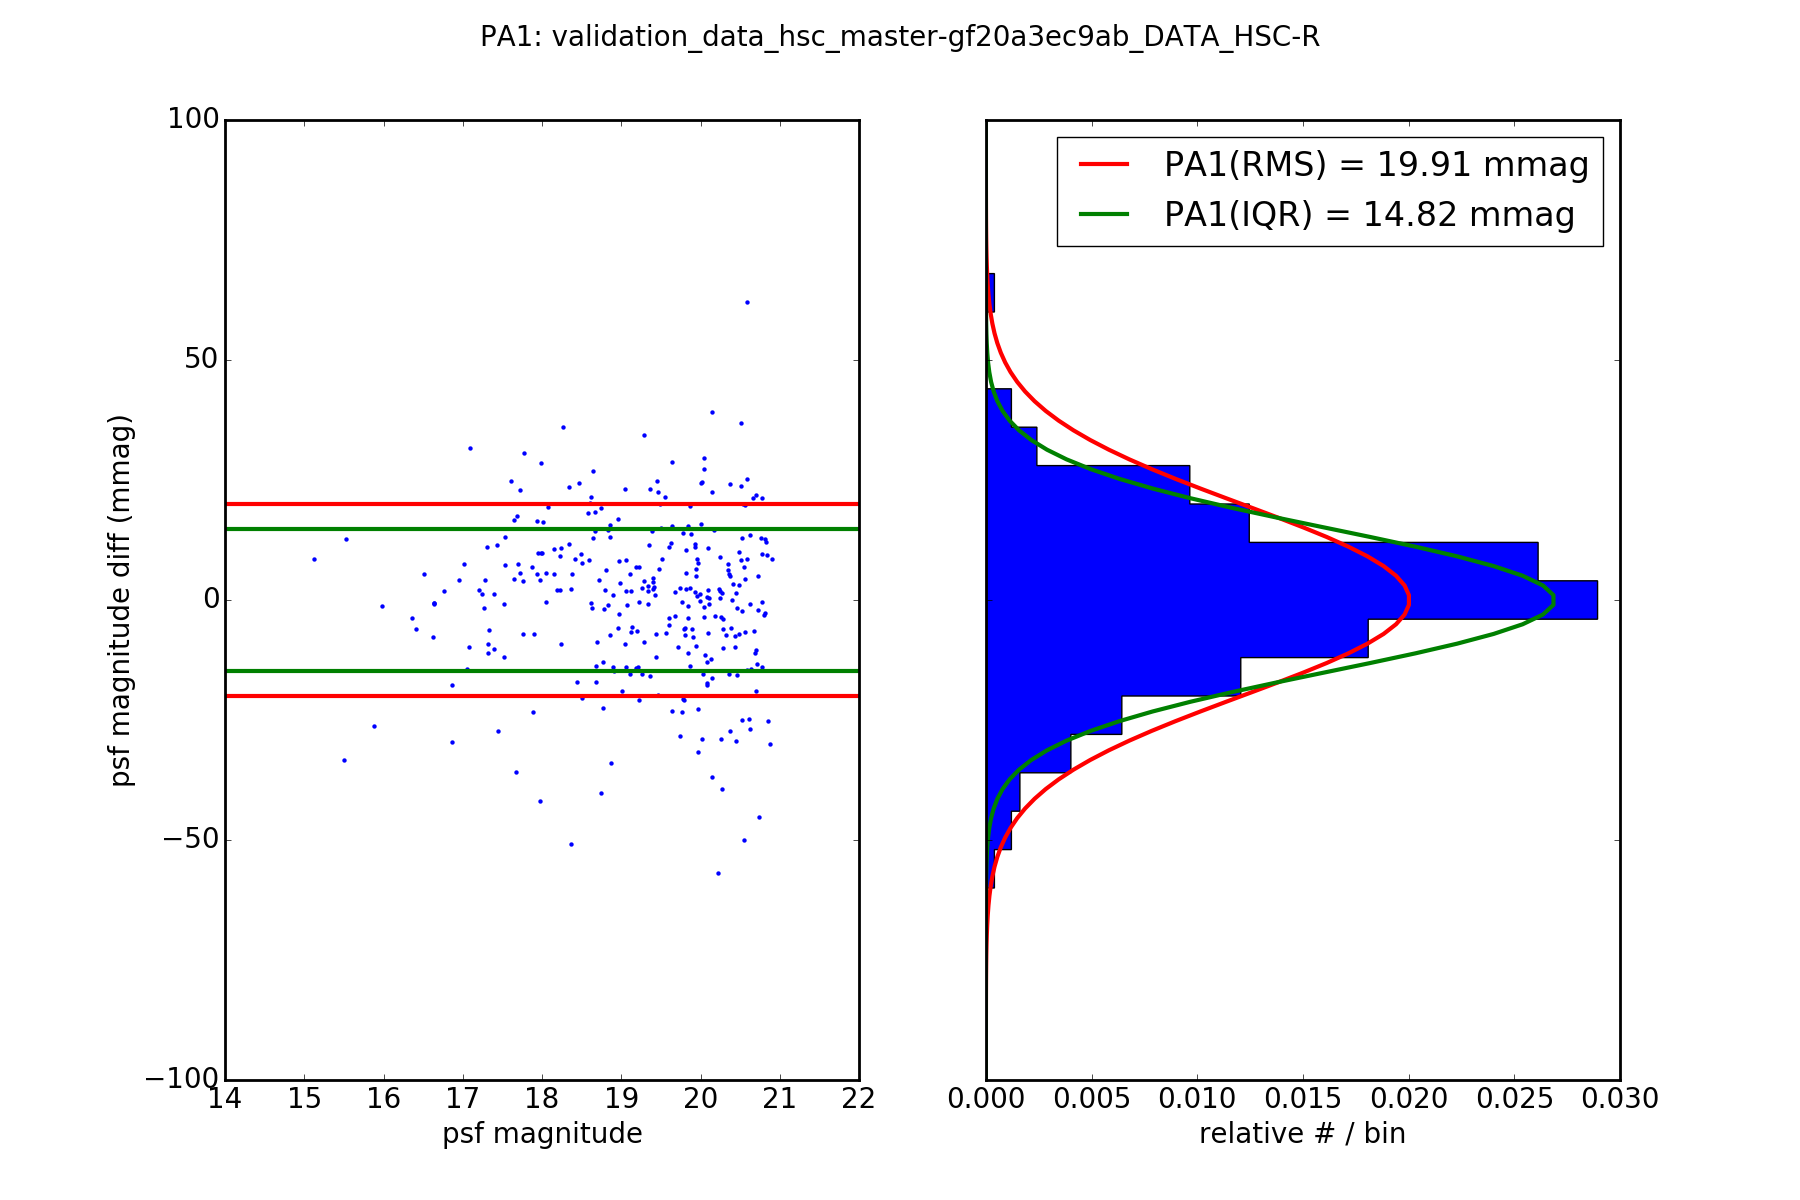
Figure 13 Difference in magnitude between the visits for the stars between 17–21.5 mag. In this example there are only two visits. In general validate_drp considers a random sample of pairs of visits.
The RMS and the inter-quartile range (IQR: 75%-25%) are each computed from the distribution of these differences in magnitudes. The reported IQR is normalized to the same scale as an RMS.
(left) Difference vs. mean magnitude. RMS (red), IQR (green) are shown as horizontal lines.
(right) Distribution of the idfferences. The RMS (ref) and IQR (green) are visualized as Gaussians with those values.
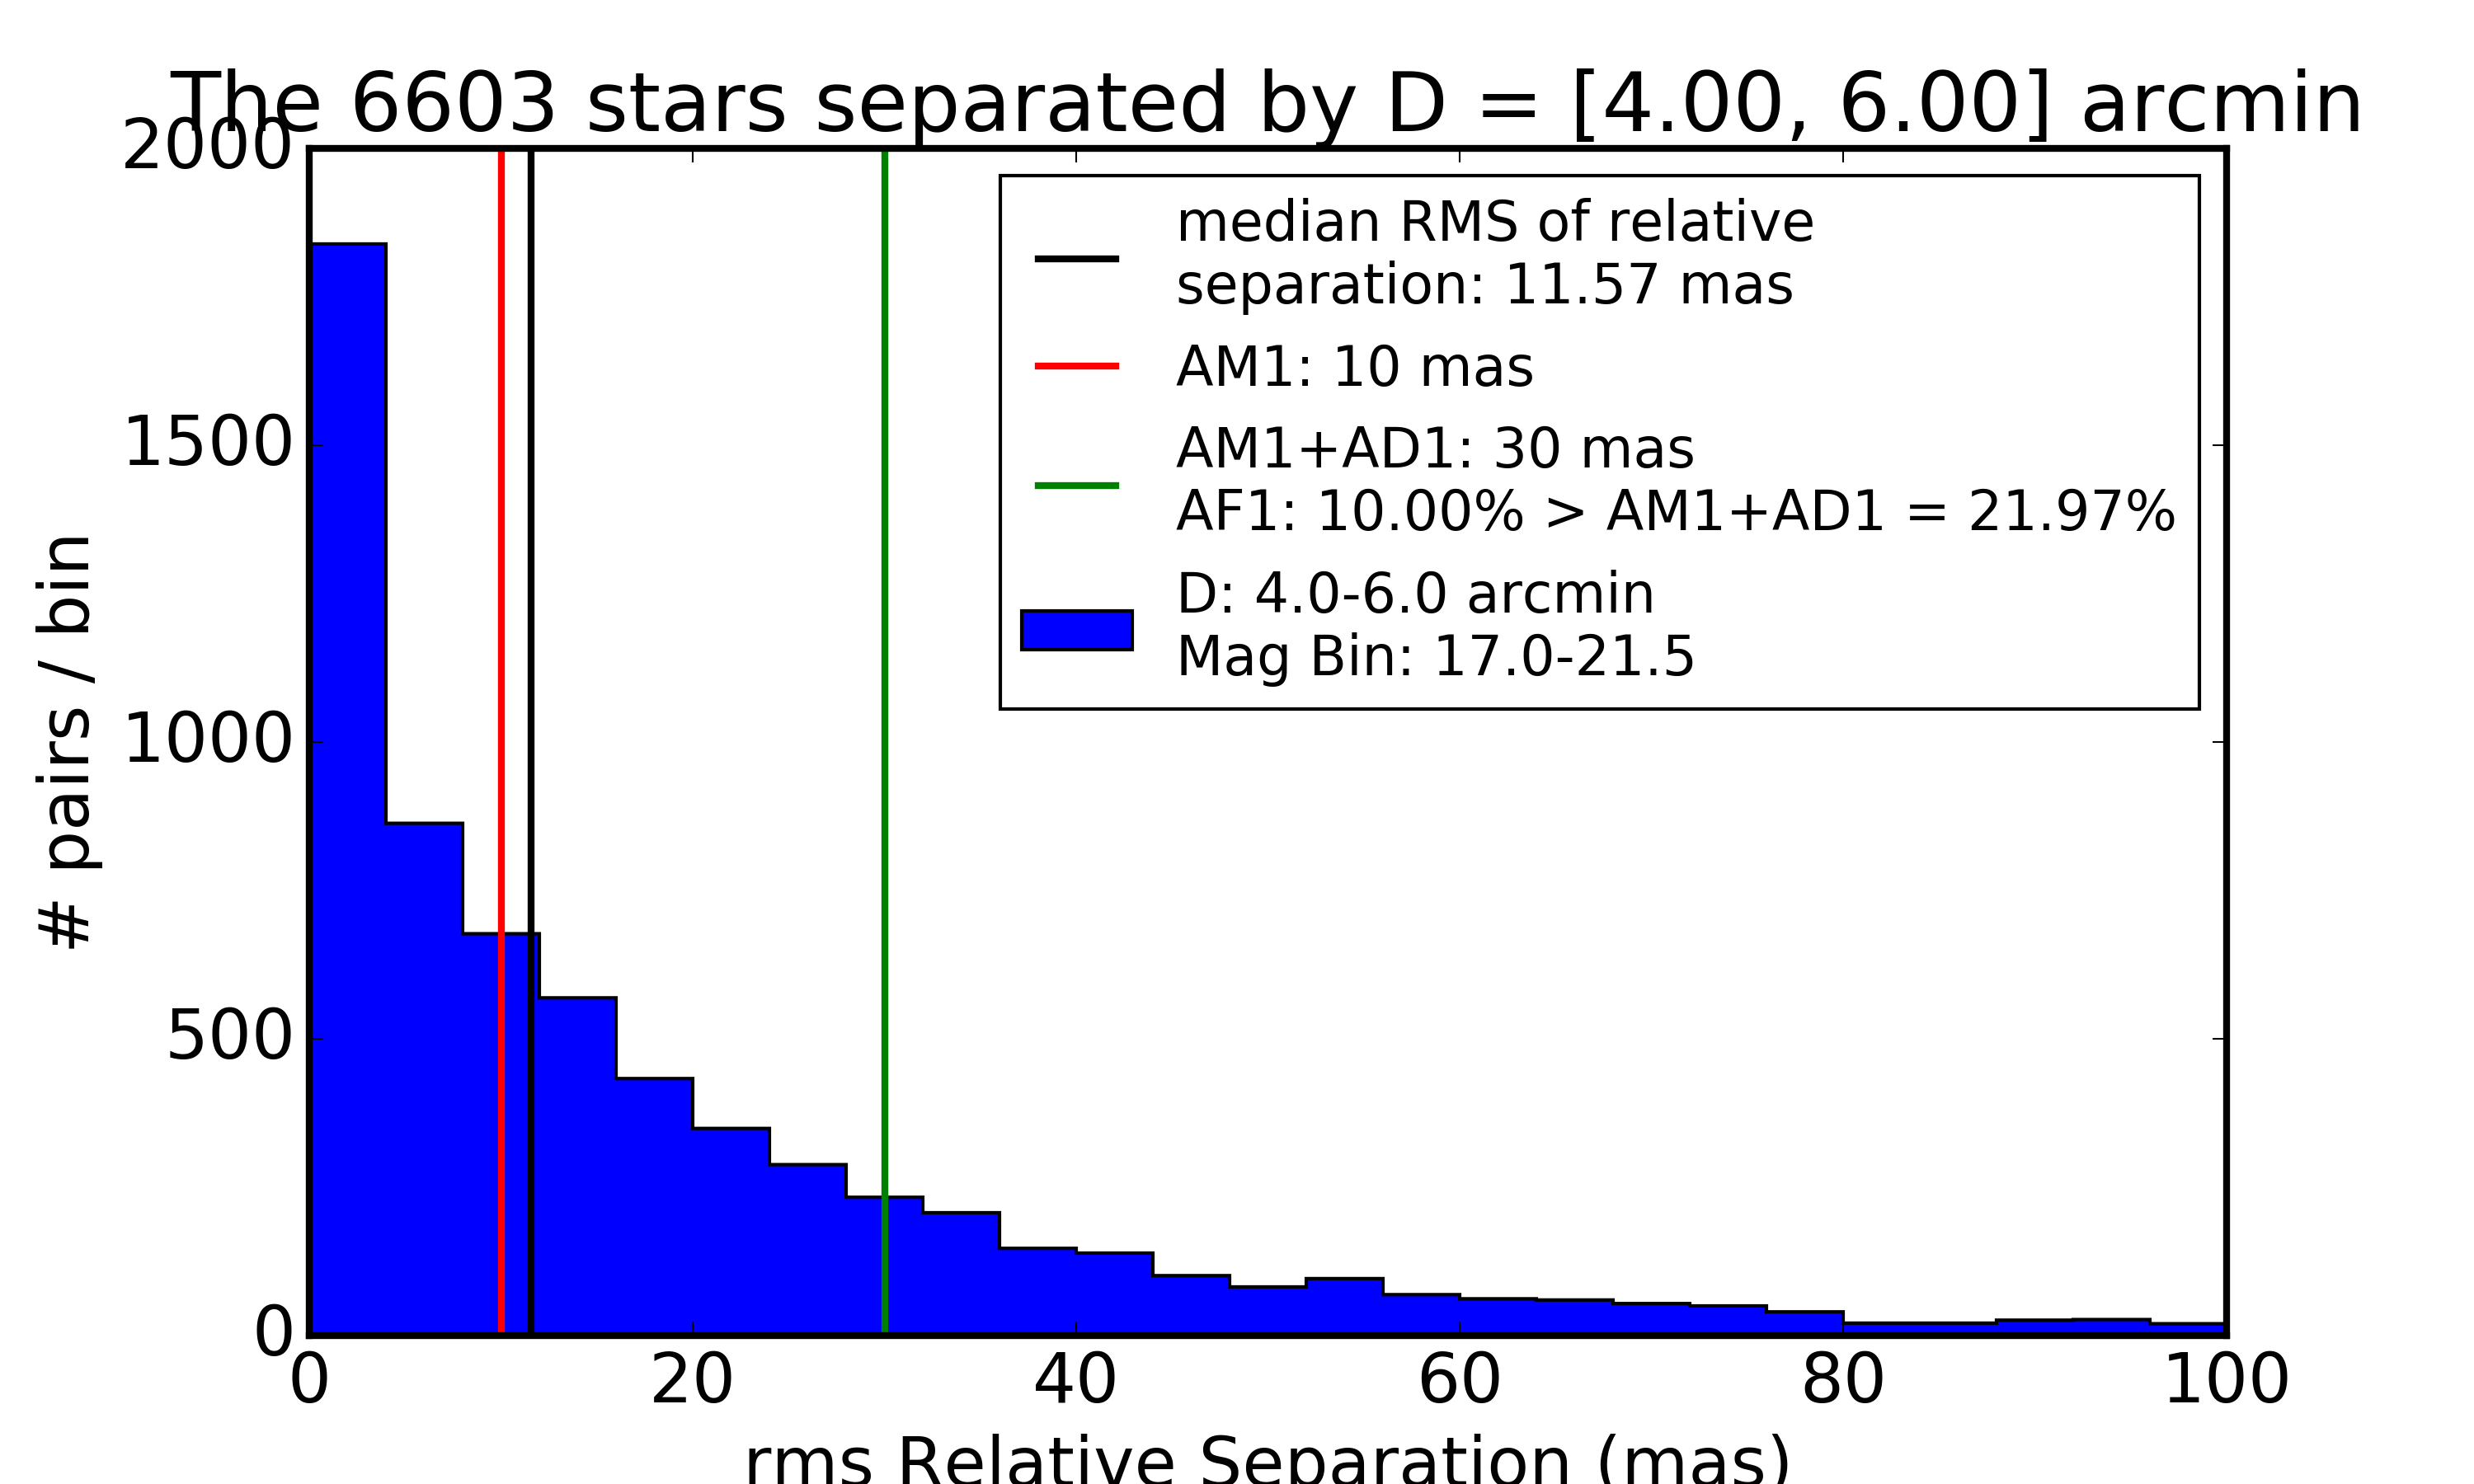
Figure 14 Distribution of the repeatability of astrometric distance between stars separted by 4-6 arcminutes. The SRD spec of AM1=10 mas is shown in red. The measured performance (black) of 11.56 mas is slightly above this spec. The SRD spec for the outlier fraction with RMS relative separation of > AM1+AD1=30 mas (green) is 21.97%, which is above the “design” specification of AF1=10%.
Caveats
- Should use aperture-corrected aperture flux instead of base_PsfFlux (DM-5804).
- Star/galaxy separation needs to be improved. You can see this incompleteness in some of the above plots of RMS vs. mag|SNR, where there seem to be clear contributes from galaxies to the brightSnr sample. (DM-5805)
Future Work
Currently scheduled improvements are as follows.
- DM-5096 Make validateDrp a Task.
- DM-5097 Update validate_drp to use TransformTask to store calibrated measurements
- DM-5098 Add tests to validate_drp to verify SRD calculations and utility function behavior
- DM-5159 Please use angle and Coord where possible
- DM-5160 Record CCD, visit of input catalog in validate_drp
- DM-5804 Use aperture-corrected aperture flux in validate_drp
- DM-5805 Improve star/galaxy separation for validate_drp
- DM-5819 Incorporate Price suggestions to make validate_drp faster